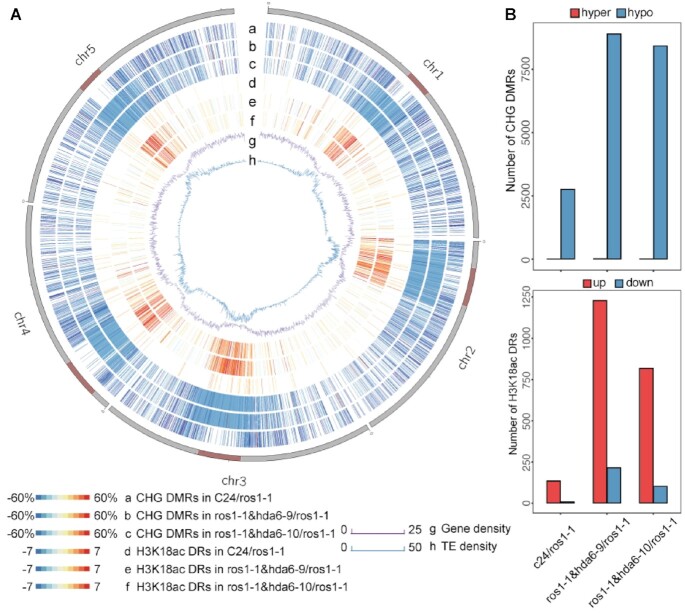
Figure 3.
Genome-wide distributions of DMRs and differential H3K18ac accumulation regions at the CHG context. (A) A Circos plot showing the distributions of DMRs in the CHG context between C24/ros1-1 (a), ros1-1&hda6-9/ros1-1 (b), and ros1-1&hda6-10/ros1-1 (c), and the differential H3K18ac accumulation between C24/ros1-1 (d), ros1-1&hda6-9/ros1-1 (e), and ros1-1&hda6-10/ros1-1 (f), with the corresponding gene densities (g) and transposable element (TE) densities (h). The dark red bars on the chromosomes indicate centromeric regions. (B) Upper panel: numbers of DMRs in C24/ros1-1, ros1-1&hda6-9/ros1-1 and ros1-1&hda6-10/ros1-1; lower panel: numbers of differential H3K18ac peaks in C24/ros1-1, ros1-1&hda6-9/ros1-1 and ros1-1&hda6-10/ros1-1.

