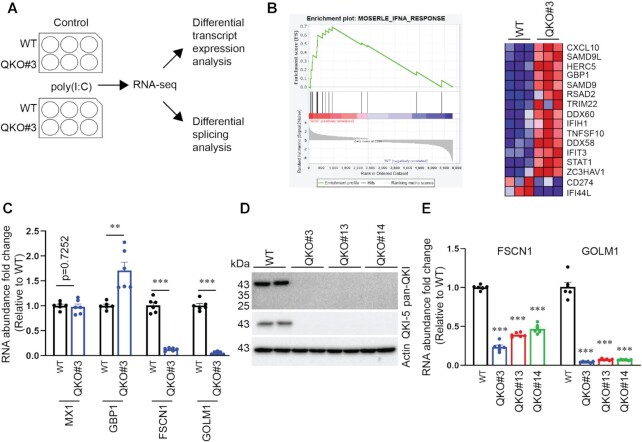
Figure 1.
Transcriptome profiling of WT and QKO#3 cells reveals QKI-dependent genes in IFN pathways. (A) Schematic illustration of experimental design. (B) Enrichment plot and heatmap from the comparison with gene set ‘MOSERLE_INFA_RESPONSE’. Red and blue indicate up-regulated and down-regulated trends respectively. (C) HuH7 WT and QKO#3 cell lysates were harvested and RNA abundance of indicated genes were measured by RT-qPCR. (D) Representative immunoblotting results showing expression level of QKI in WT and various QKO cells. (E) RNA abundance of FSCN1 and GOLM1 in HuH7 WT and QKO cells by RT-qPCR. The RT-qPCR data were reported relative to the WT. Data are mean ± SEM from two independent experiments, and each experiment had three wells that were treated independently (replicates = 6). Each dot represents one biological replicate. Statistical significance was determined using a two-tailed t test: **P < 0.01; ***P < 0.001.

