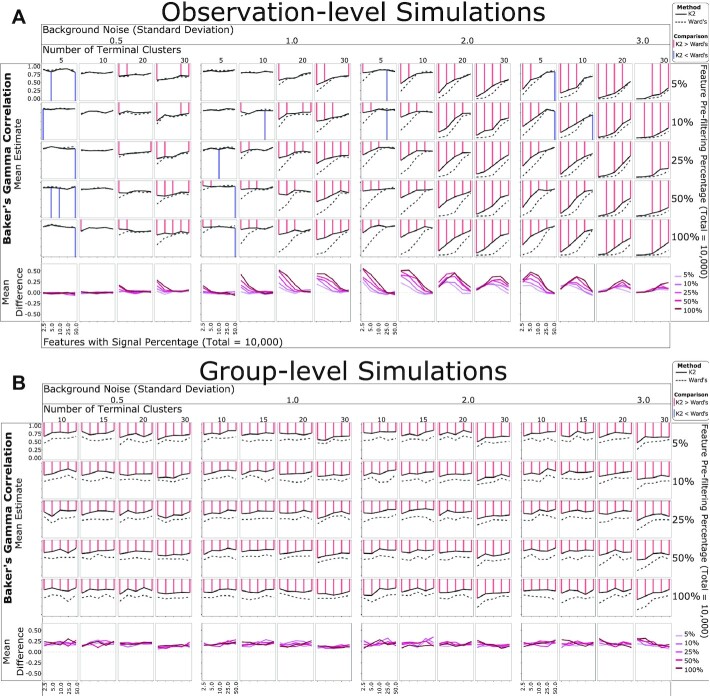
Figure 2.
Simulation-based performance assessment of K2Taxonomer and Ward's agglomerative method. Mean Baker's gamma correlation estimates measuring the similarity of either K2Taxonomer and Ward's agglomerative method estimates to the true hierarchy from which the simulated data was generated. Each combination of parameters was simulated 25 times. The red and blue lines are indicative of statistically significant differences between the correlation estimates (FDR < 0.05) based on a Wilcoxon signed-rank test. (A) Observation-level analyses with 300 observations and 10,000 features. (B) Group-level analyses with 1000 observations and 10,000 features.

