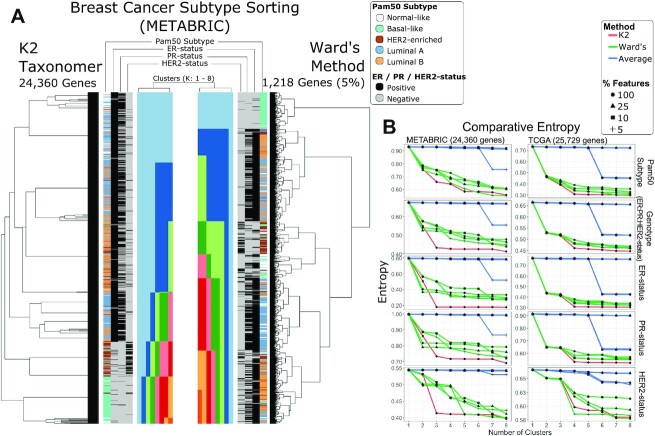
Figure 3.
Breast cancer subtyping performance assessment of bulk gene expression data. Comparison of sorting of breast cancer Pam50 subtypes and genotypes (ER-, PR- and ER-status) for two bulk gene expression data sets, METABRIC and TCGA. An aggregate, three gene genotype status was also included by combining the individual genotypes. Performance was assessed based on reduction of entropy as the number cluster estimate increased based on tree cutting. K2Taxonomer was only run on the full set of features, while either agglomerative method, average and Ward's, were run on three additional subsets of the data. (A) Illustration of the results generated by K2Taxonomer and Ward's method for the METABRIC dataset. These results reflect Ward's method run on 5% of the total number of features, which demonstrated the best performance among agglomerative methods. (B) Entropy measurements for each method as K increased across the METABRIC and TCGA data sets.

