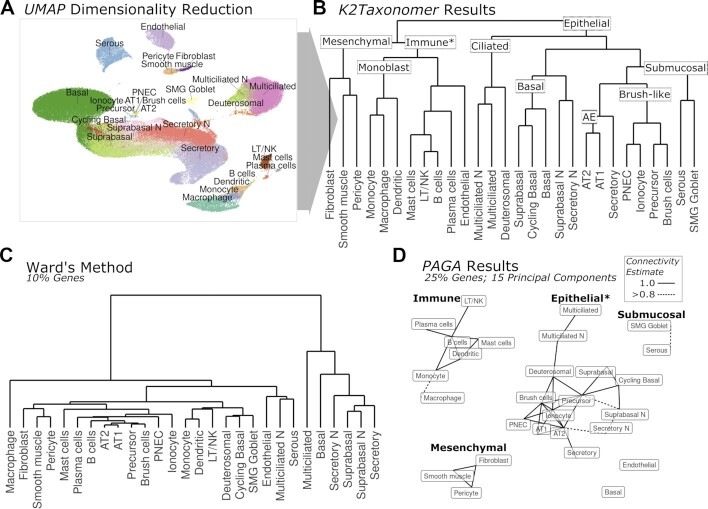
Figure 4.
Subgrouping of healthy airway cell types from scRNAseq data. (A) tSNE dimensionality reduction of healthy airway scRNAseq data with labels for 28 cell types annotated by (29). Note cell types labelled ending in ‘N’ indicate those which only included cells from nasal samples. (B) K2Taxonomer results with nine annotated subgroups. The ‘*’ in the ‘Immune’ subgroup label indicates the impurity of this subgroup caused by the presence of endothelial cells. (C) Ward's agglomerative clustering results for a selected analysis performed on 10% of the total number of genes. The results for both Ward's method and Average method run on additional gene subsets: 100%, 25%, 10% and 5%, are shown in Supplementary Figure S2. (D) PAGA graph-based trajectory results for a selected analysis performed on 15 principal components estimated from 25% of the total number of genes with four annotated disconnected subgraphs. The ‘*’ in the ‘Epithelial’ subgroup label indicates the incompleteness of this subgraph caused by the absence of basal cells and submucosal cells. Edges indicate PAGA connectivity estimates >0.8. The results for analyses run on additional numbers of principal components: 10, 15 and 20, as well as additional gene subsets: 100%, 25%, 10% and 5%, are shown in Supplementary Figure S3.

