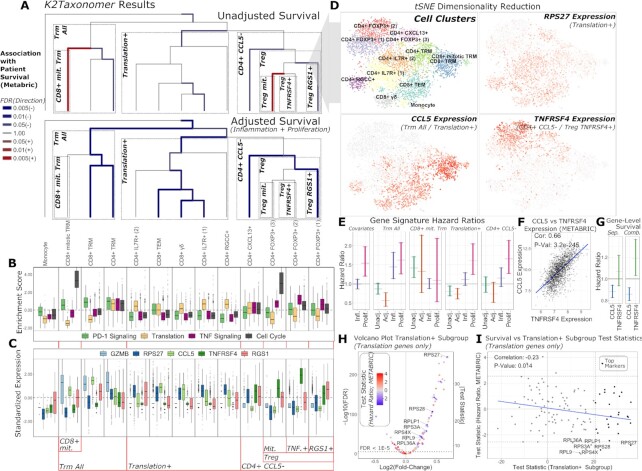
Figure 5.
K2Taxonomer annotation of scRNA-seq clustering of breast cancer immune cell data and in-silico validation via patient survival on METABRIC breast cancer bulk gene expression data set. (A) K2Taxonomer annotation of 13 cell subtypes of breast cancer immune cell populations. Cell type labels are in accordance with the original publication (29). Color and thickness of each edge indicate direction and strength, respectively, of the association between the projected signature of up-regulated genes of each subgroup and patient survival in METABRIC breast cancer cohort via Cox proportional hazards testing. The top and bottom dendrograms show the results without and with adjustments of covariates for inflammation and proliferation. Blue and red are indicative of hazard ratio <1 and hazard ratio >1, respectively. All models included age and PAM50 subtype as covariates. (B) Boxplots of gene set projection scores of selected REACTOME pathways, enriched in subgroups of immune cells. These pathways include: PD-1 Signaling, enriched in the Trm All subgroup, Translation, enriched in the Translation+ subgroup, TNF Signaling, enriched in the CD4+ CCL5- and Treg TNFRSF4+ subgroups, and Cell Cycle, enriched in the CD8+ mit. Trm and Treg mit. Subgroups. The center line, hinges, and whiskers indicate the median, interquartile range, and extreme values truncated at 1.5 * the interquartile range, respectively. (C) Boxplots of markers constitutively regulated in selected K2Taxonomer subgroups. GZMB is upregulated in the Trm All subgroup. CCL5 and TNFRSF4 are up- and down-regulated, respectively, in the CD4+ CCL5− subgroup. TNFRSF4 is further up-regulated in the Treg TNFRSF4+ subgroup, while RGS1+ is up-regulated in the Treg RGS1+ subgroup. Finally, RPS27 is up-regulated in the Translation+ subgroup. The center line, hinges and whiskers indicate the median, interquartile range and extreme values truncated at 1.5 * the interquartile range, respectively. (D) tSNE dimensionality reduction of the single-cell breast cancer immune cell data, indicating the cell subtype label assignment of every cell, as well as Z-scored expression of selected genes from C. (E) 95% confidence intervals of hazard ratios from Cox proportional hazards testing of gene set projections of cellular subgroups on the METABRIC data set. Covariates shows the results of the survival model of sample-level inflammation and proliferation scores without a K2Taxonomer derived signature. Every other model shows the confidence interval of the subgroup-specific model without and with adjusting for inflammation and proliferation score, as well as the confidence intervals of inflammation and proliferation in the full model. All models included age and Pam50 breast cancer subtype as covariates. (F) Comparison of the expression of CCL5 and TNFRSF4 expression in the METABRIC dataset. (G) 95% confidence intervals of hazard ratios from Cox proportional hazards testing of gene-level expression of CCL5 and TNFRSF4, modelled separately, Sep., and combined in a single model, Comb. These models also included age, Pam50 breast cancer subtype, as well as sample-level inflammation and proliferation score as covariates. (H) Volcano plot of differential expression analysis of the Translation+ subgroup in scRNAseq data of individual genes in the REACTOME eukaryotic translation initiation gene set. An alternative coding of the y-axis indicating the absolute value of the test statistic is shown on the right side of the plot. The colors indicates the association of each gene with survival in the METABRIC data set. Genes significantly associated with better survival (hazard ratios < 1, FDR < 0.1) are labelled. (I) Comparison of the association between survival and expression of the REACTOME eukaryotic translation initiation gene set (y-axis) and the test statistics indicating up-regulation in the Translation+ subgroup (x-axis) in the METABRIC data set. Genes that were included as top markers of the Translation+ subgroup are highlighted. Genes significantly associated with better survival (hazard ratios < 1, FDR < 0.1) are labelled. The blue line indicates the linear fit of these two variables.

