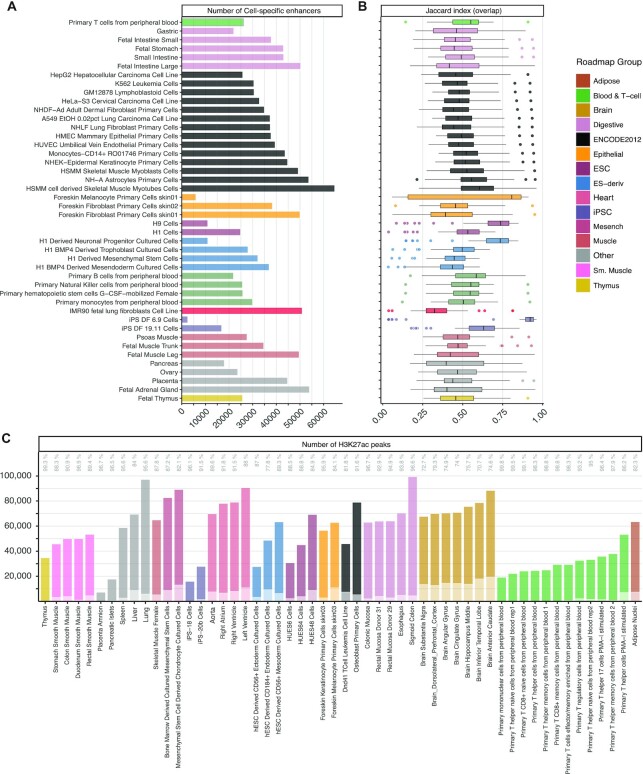
Figure 2.
Definition of the reference enhancer catalogue. (A) Number of cell-specific enhancers resulting from the intersection of DNase-seq and H3K27ac ChIP-seq peaks in a selected set of 44 cell and tissue types collected by the Roadmap Epigenomics consortium, coloured by Roadmap groups. (B) Similarity (Jaccard index on overlap) among cell-specific set of enhancers. Each data point in the boxplots represents the ratio between the intersection of two cell-specific sets of enhancers over their union, taking as reference the group on the row. The median is marked with a line across each box, the box margins mark the interquartile range (IQR), the whiskers extend up to 1.5 IQR and individual data points are shown for outliers beyond this range. (C) Number of H3K27ac ChIP-seq peaks of 54 additional cell and tissue types from the Roadmap Epigenomics project that overlap (darker colour shade) or do not overlap (lighter colour shade) with the union of H3K27ac ChIP-seq merged peaks of the set of cell and tissue types used to define the reference catalogue of active enhancers. The percentages of total H3K27ac peaks extension overlap are reported as text labels on top.

