Figure 4.
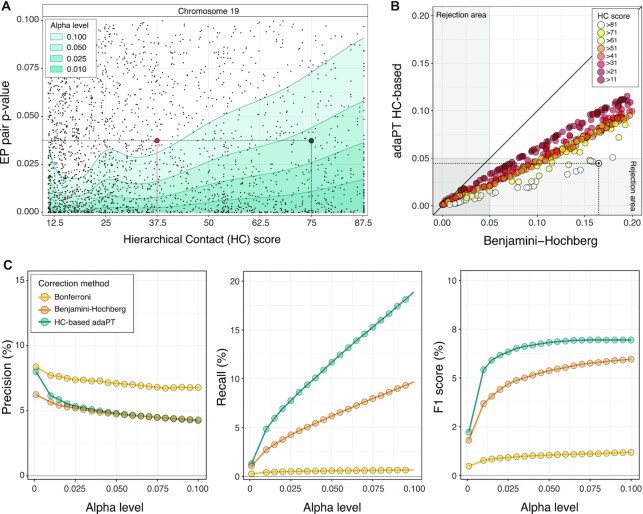
Physical proximity increases power of detection. (A) Estimated iterative adaptive rejection threshold (AdaPT) leveraging side information derived from HC scores (x-axis), for a representative subset of chromosome 19 at different alpha levels (green-shadow areas). Each point reports the CCA P-value for the synchronised activity between an EP pair (y-axis). Highlighted, two EP pairs with the same nominal P-values, but different HC scores, for which the null hypothesis of independence is rejected at a confidence level of 0.95 (green point, high score), and not rejected (red point, low score). (B) P-values associated to a representative subset of EP pairs for chromosome 19 adjusted with Benjamini-Hochberg (x-axis) and AdaPT (y-axis) approaches, coloured by HC score thresholds. Highlighted with a solid black dot, an example EP pair located within the same TADs for all cell and tissue types and hierarchies (i.e., HC score>81), for which the null hypothesis of independence is rejected at a confidence level of 0.95 only by HC-based AdaPT approach. (C) Precision, recall and F1 score of predicted EP pairs based on eQTLs-supported ETG pairs (GTEX and PanCanQTL) over different alpha levels (x-axis), adopting three different multiple-testing correction approaches: Bonferroni (yellow), Benjamini-Hochberg (orange) and HC-based AdaPT (green). These same precision and recall curves are reported in Supplementary Figure S3D and S3E along with the curves obtained with alternative versions of HC score.

