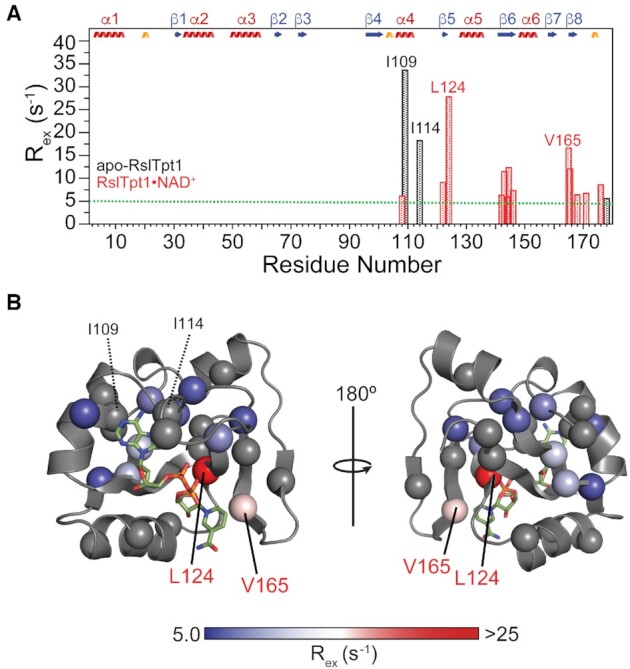
Figure 7.

Conformational exchange in the RslTpt1 C-lobe when bound to NAD+. (A) Exchange contributions [Rex =  > 5 s−1] to the multiple-quantum relaxation rates of Ile (δ1), Leu, Val and Met methyl resonances for apo-RslTpt1 (black) and the RslTpt1·NAD+ complex (red) are plotted against residue number. Those residues that display the largest Rex values for the apo (Ile109: 33.6 s−1 and Ile114: 18.2 s−1) and the NAD+-bound states (Val124: 27.8 s−1 and Val165: 16.6/12.1 s−1) are labeled. (B) The Rex values of methyl groups (denoted by spheres) are mapped onto the structure of the C-lobe in its NAD+-bound state and shown using a blue to red gradient; methyl groups without any detectable Rex values are colored gray. Leu124 that shows the largest exchange contribution in the bound state lies in close spatial proximity to the phosphate backbone; Val165, whose methyl groups display substantial Rex values contact the nicotinamide moiety. Also indicated (in black font) are Ile109 and Ile114 that show substantial Rex values in the unliganded state. These residues, that engage the adenosine moiety of NAD+, have no detectable exchange contributions in the NAD+-bound state.
