Figure 1.
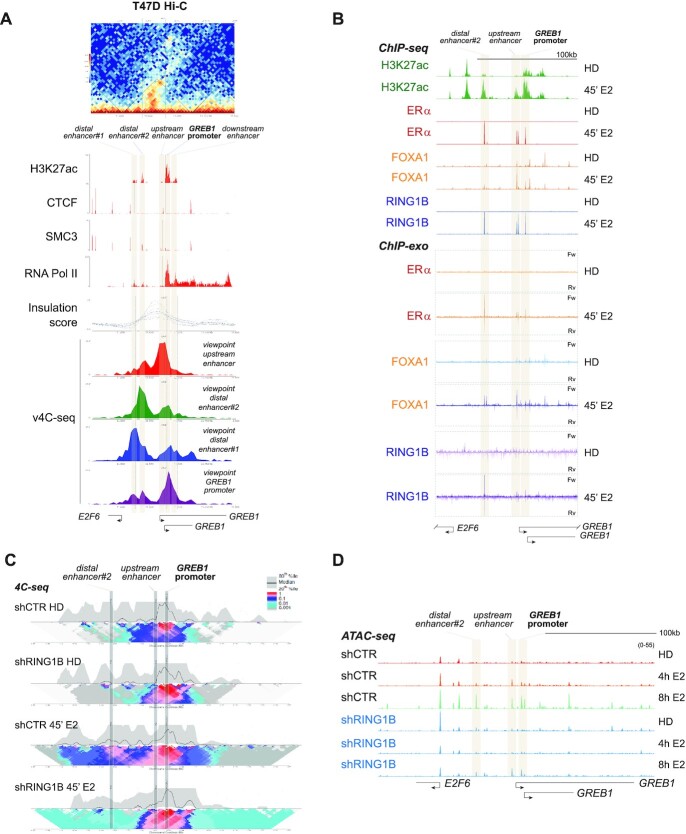
RING1B coordinates estrogen-induced 3D chromatin architectural changes. (A) Top: Hi-C heatmap of 3D chromatin interactions around the GREB1 promoter showing the formation of a distinct TAD. Middle: CTCF and SMC3 ChIP-seq tracks define the boundary of the TAD containing five sites enriched for H3K27ac. The TAD is further demarcated by the insulation score. RNA Pol II track demarcates the GREB1 TSS. Bottom: v4C-seq centered (i) around the upstream enhancer (red track), (ii) distal enhancer#2 (green track), (iii) distal enhancer#1 (blue track) and (iv) the GREB1 promoter (purple track) show extensive intra-TAD interactions around the GREB1 promoter. (B) H3K27ac, ERα, FOXA1 and RING1B ChIP-seq tracks as well as the ChIP-exo tracks of ERα, FOXA1, and RING1B before and after 45 min of E2 stimulation depicting colocalization of the second distal enhancer (site 2), the proximal enhancer (site 3) and the GREB1 promoter (site 4) with ERα, RING1B and FOXA1. (C) 4C-seq in T47D shCTR and shRING1B cells before (HD) and after 45 min of E2 stimulation, centering the viewpoint around the GREB1 promoter. The median and 20th and 80th percentiles of sliding 5-kb windows determine the main trend line. Color scale represents enrichment relative to the maximum attainable 12-kb median value. (D) T47D shCTR and shRING1B ATAC-seq tracks after 4 and 8h of E2 stimulation, n = 2.

