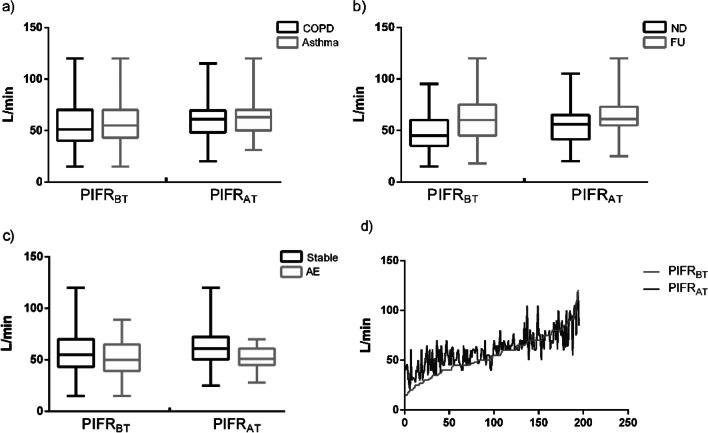
Fig. 2.
Distribution and variation trend of PIFR in COPD/Asthma group, ND/FU group, AE/Stable group and all patients. Figure describes the distribution and changes of PIFRBT and PIFRAT for patients using DPIs in COPD/Asthma group, ND/FU group, AE/Stable group and all patients. a is a box diagram showing the improvement from PIFRBT to PIFRAT in COPD/Asthma group. b is a box diagram showing the improvement from PIFRBT to PIFRAT in ND/FU group. c is a box diagram showing the improvement from PIFRBT to PIFRAT in AE/Stable group. d is a line chart for PIFRBT and PIFRAT in all patients, which the two values corresponding to each abscissa value are PIFRBT and PIFRAT of the same patient. When the patient's PIFR was relatively low, training increases the PIFR value more obviously. COPD, chronic obstructive pulmonary disease; AE, acute exacerbation; ND, newly-diagnosed; FU, follow-up; PIFRBT, peak inhalation flow rate measured before-training; PIFRAT, peak inhalation flow rate measured after training

