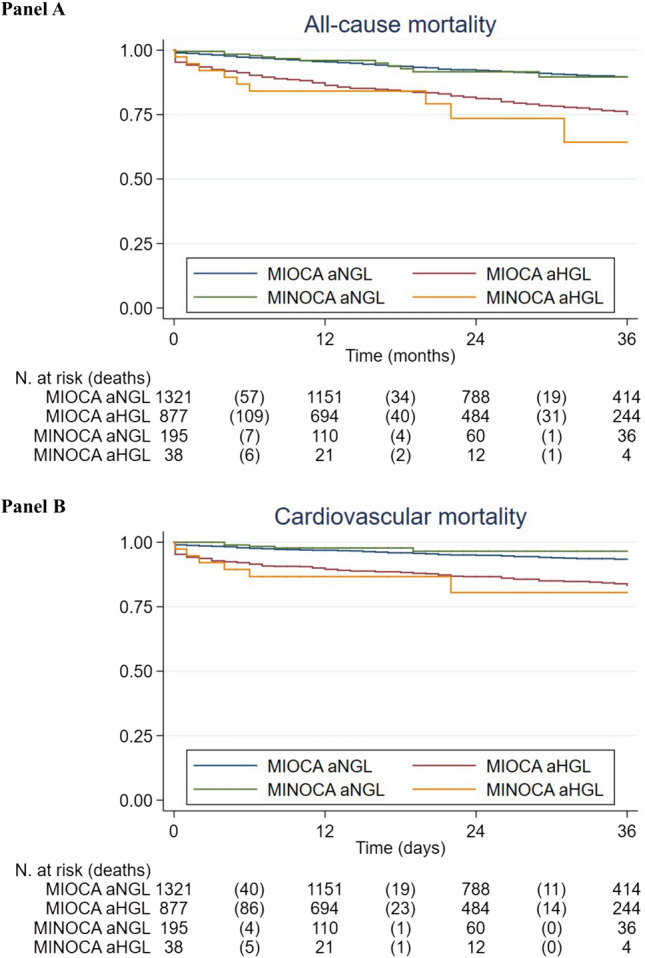
Fig. 1.

Kaplan–Meier survival curves in AMI patients with and without hyperglycemia. A All-cause mortality. Significant pairwise differences were found for MINOCA with and without hyperglycemia (p < 0.01), MIOCA with and without hyperglycemia (p < 0.001); MIOCA with hyperglycemia and MINOCA without hyperglycemia, (p < 0.05), MINOCA with hyperglycemia and MIOCA without hyperglycemia (p < 0.001), B cardiovascular mortality MIOCA with hyperglycemia and MINOCA without hyperglycemia (p = 0.011), MINOCA with hyperglycemia and MIOCA without hyperglycemia (p < 0.01), MINOCA with and without hyperglycemia (p = 0.0011), MIOCA with and without hyperglycemia (p < 0.001)
