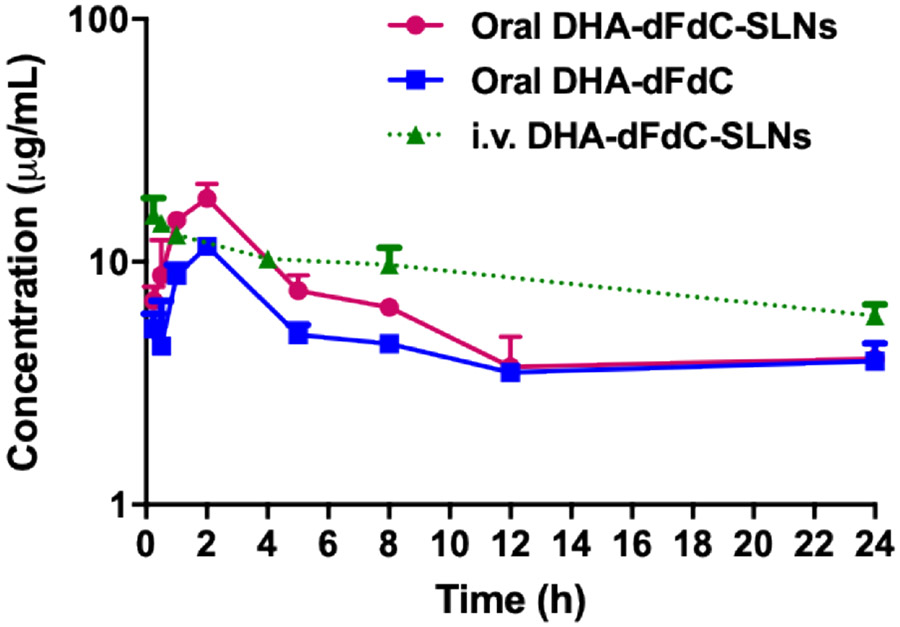
Figure 3.
Plasma DHA-dFdC concentration-time curves after oral administration of DHA-dFdC-SLNs in suspension or DHA-dFdC in Tween 80/ethanol-in-water solution, or i.v. administration of DHA-dFdC-SLNs in suspension in healthy C57BL/6 mice. The dose of DHA-dFdC was 2 mg per mouse. Data shown are mean ± SD (n = 3). Data of the i.v. DHA-dFdC-SLNs group were adapted from reference (7) (we will request for copyright permission upon the acceptance of this manuscript).

