
FIGURE 7.
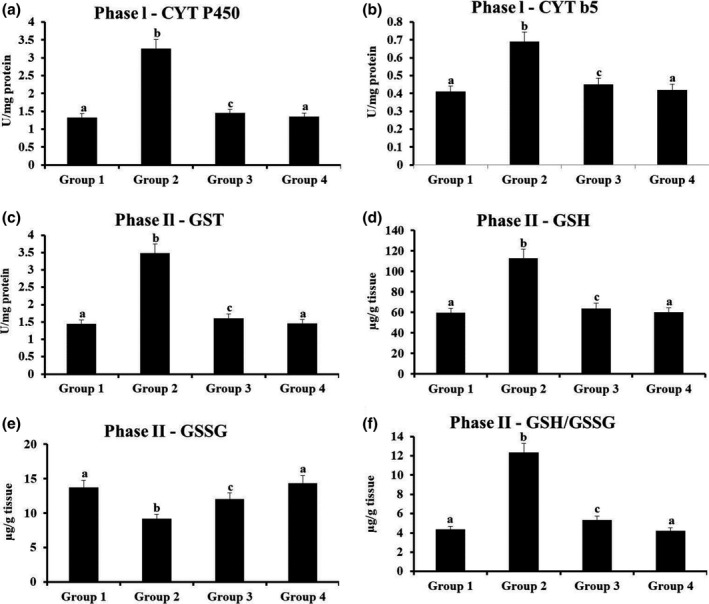
The status of phase I and phase II detoxification enzymesin the oral mucosa of experimental hamsters. Results are expressed as mean ± SD for six hamsters in each group. Data not sharing a common superscript (a–c) differ significantly at p < 0.05 (DMRT)