FIGURE 2.

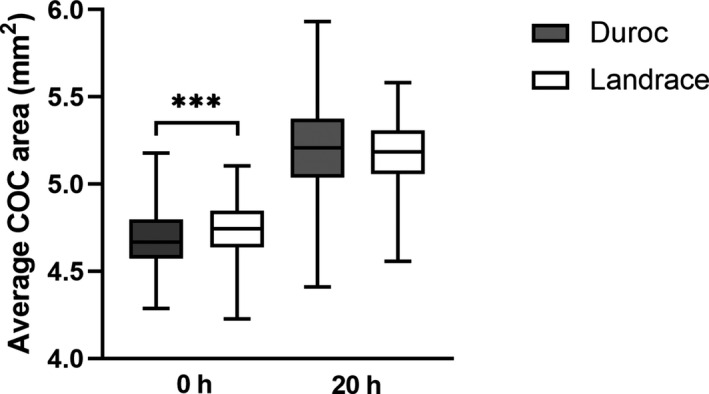
Average cumulus‐oocyte complex (COC) area at 0 hr and 20 hr of maturation for 375 Norwegian Duroc and 304 Norwegian Landrace COCs. The data were log transformed before analysis. ***p < 0.0001

Average cumulus‐oocyte complex (COC) area at 0 hr and 20 hr of maturation for 375 Norwegian Duroc and 304 Norwegian Landrace COCs. The data were log transformed before analysis. ***p < 0.0001