
Fig. 6.
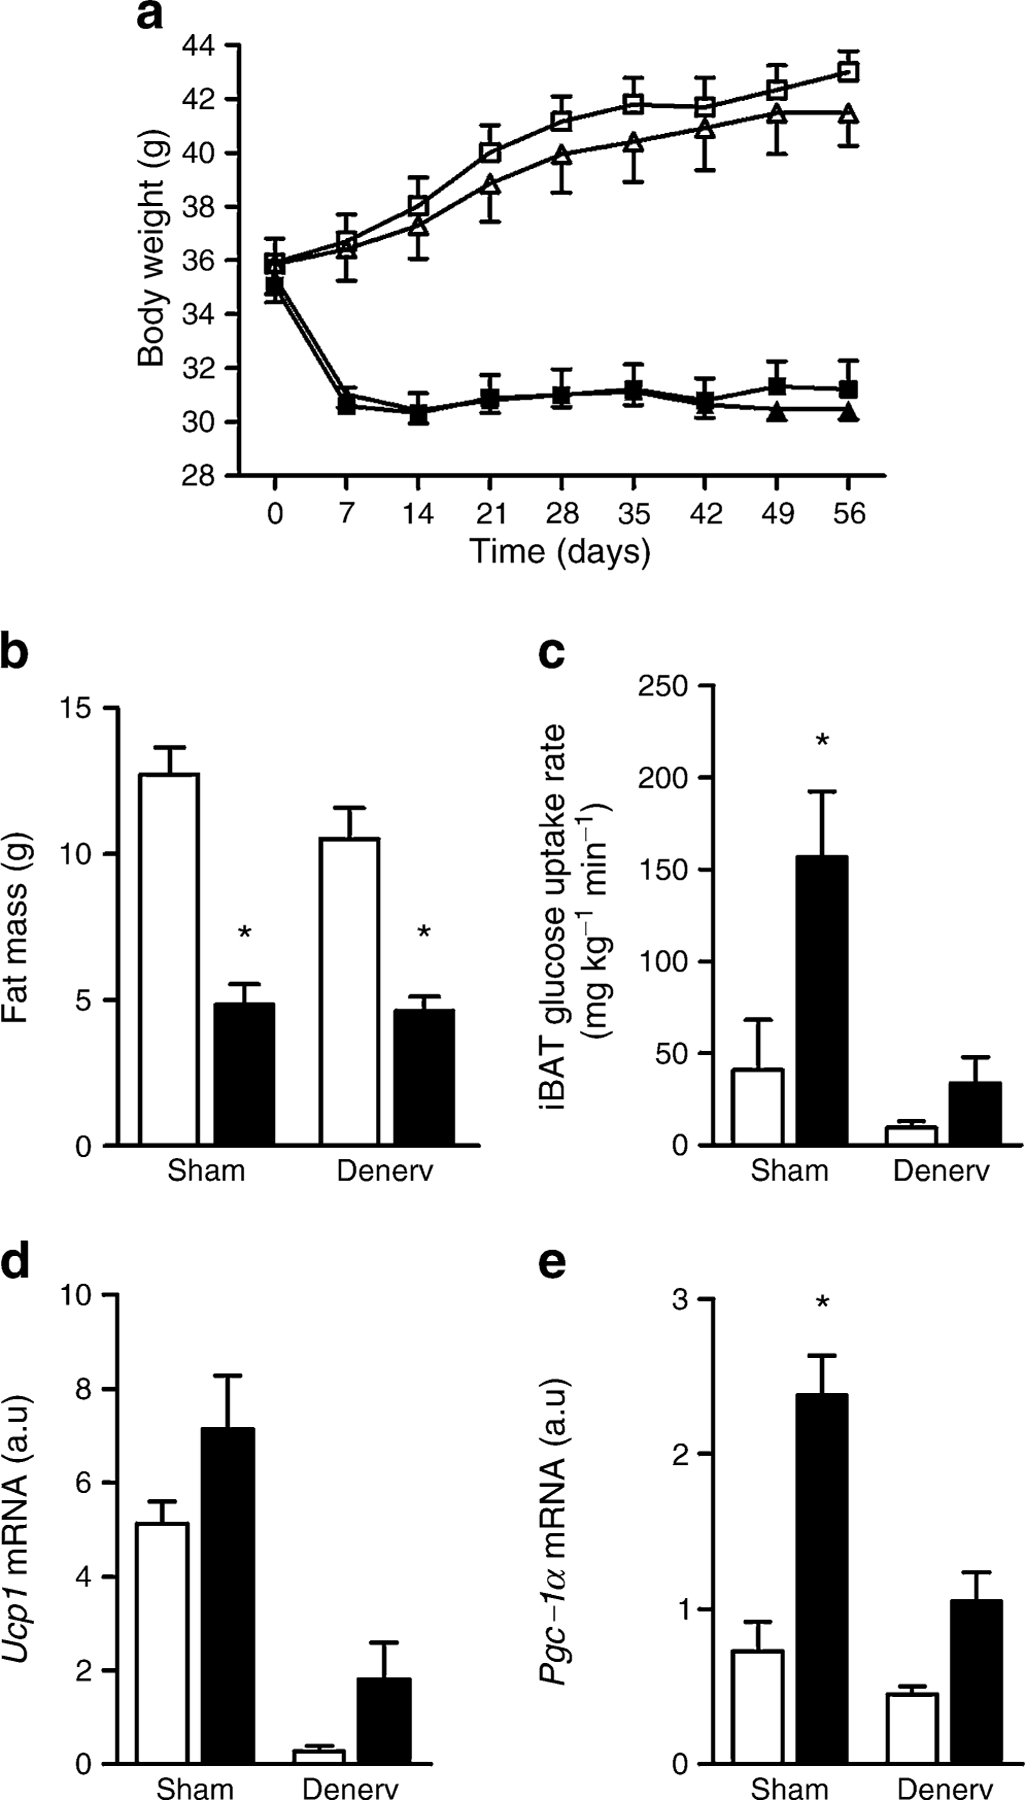
Effect of denervation on body weight, adiposity and iBAT glucose uptake and gene expression. a Body weight of SR and VEH animals (black and white symbols, respectively) that had sham operation or iBAT denervation (squares and triangles, respectively). In b–e, white bars and black bars represent VEH and SR groups, respectively. b Fat mass of SR and VEH animals that had sham operation or iBAT denervation. c–e Activation of iBAT in sham-operated and denervated animals after chronic treatment with SR141716. c Glucose uptake in iBAT measured by 2-deoxy-[U-14C]glucose under hyperinsulinaemic conditions. d Ucp1mRNA expression (by two-way ANOVA: main effect of SR and denervation p≤0.05). e Pgc-1α mRNA expression. For a and b, n=13/group; for c, n=8/group; and for d and e, n=5/group; *p<0.05 SR group vs VEH group. a.u., arbitrary units; Denerv, denervated