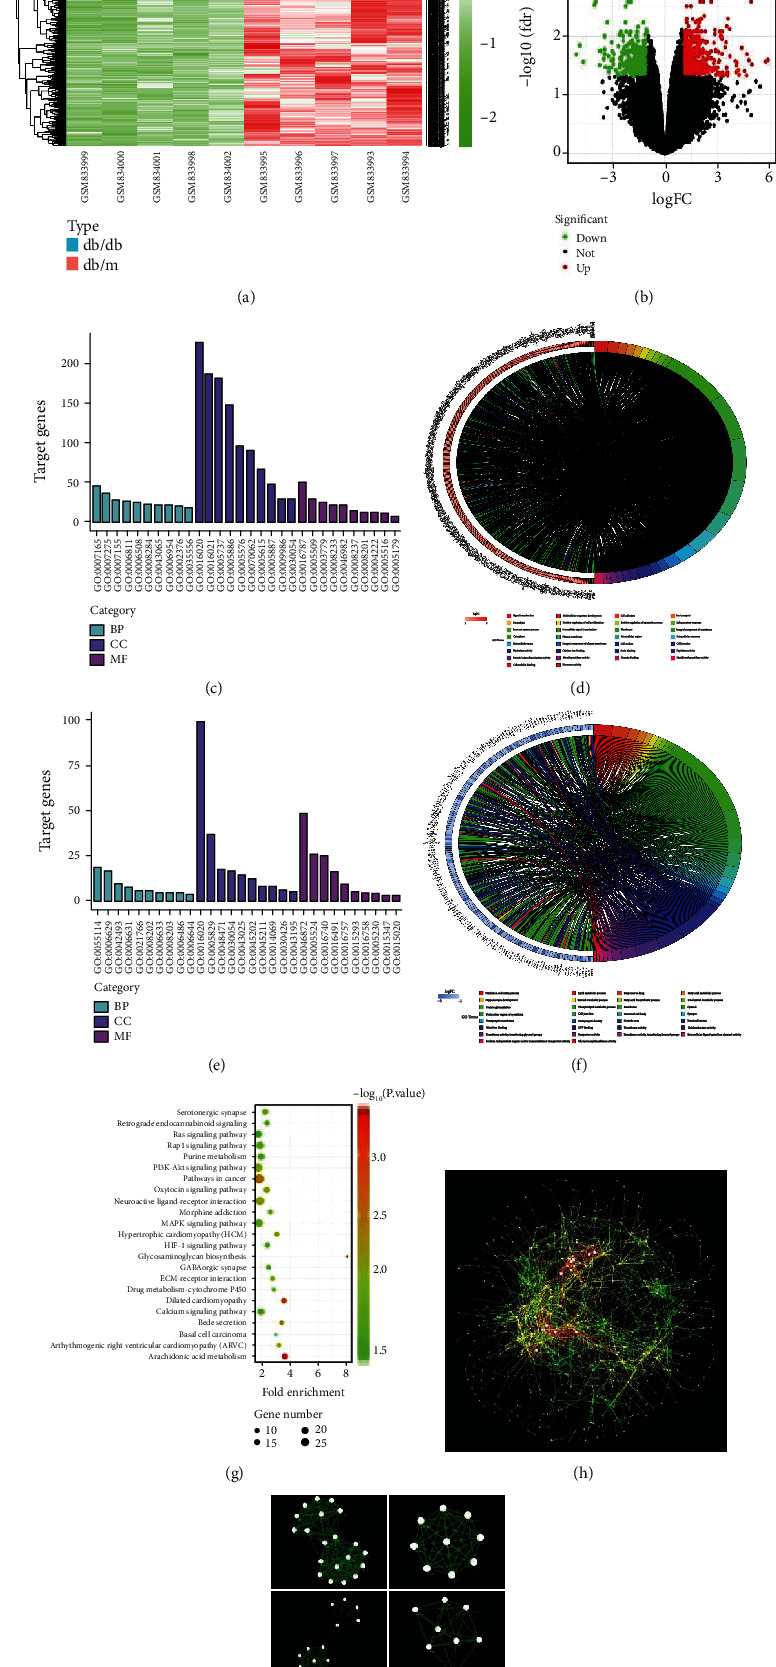
Figure 1.

Identification of DEGs and biological pathways between nondiabetic and diabetic mice renal glomerular in GSE33744. (a) Heatmap of DEGs. Red represents an upregulated gene, and green represents a downregulated gene. Legend on the top right indicates the log fold change of the genes. (b) Volcano plot of DEGs. Red represents an upregulated gene, and green represents a downregulated gene. Black represents no significant change in gene expression. (c) Top 30 enriched GO terms of upregulated DEGs. (d) Distribution of upregulated DEGs in different GO-enriched functions. (e) Top 30 enriched GO terms of downregulated DEGs. (f) Distribution of downregulated DEGs for different GO-enriched functions. (g) KEGG pathway enrichment analysis of DEGs. (h) PPI network of DEGs. Every node represents a gene-encoded protein, and each edge represents the interaction between them. The edge color represents the core degree of protein. (i) Top 6 functional modules identified from the PPI network.
