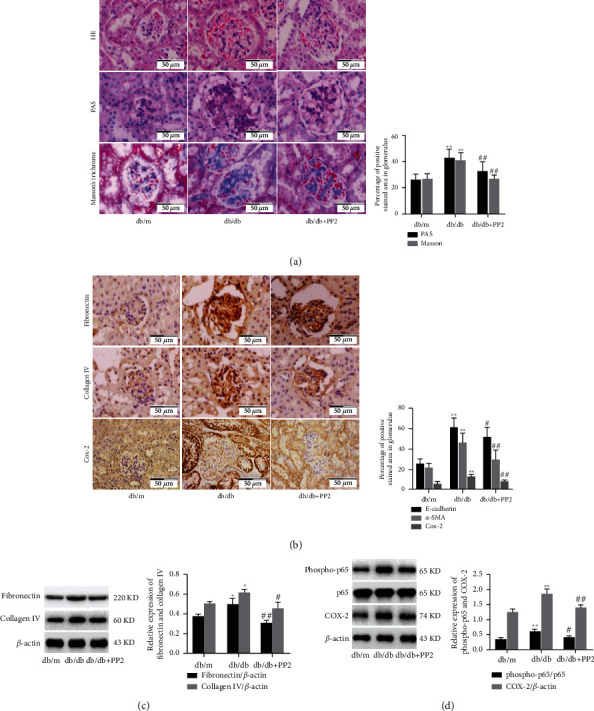
Figure 2.

Effect of c-Src inhibiton on ECM accumulation and fibrosis in the renal glomerulus of diabetic mice. (a) HE, PAS, and Masson's trichrome staining of kidney sections (original magnification ×400). (b) Immunohistochemical staining of kidney sections with fibronectin and collagen IV (original magnification ×400). (c) The expression levels of fibronectin and collagen IV analyzed by western blotting. (d) The expression levels of phospho-p65, p65, and COX-2 analyzed by western blotting. The number of mice in every group was 10. 10 visual fields were randomly selected from each group, and the area percent of staining was calculated for statistical analysis. All western blotting experiments were performed independently at least in triplicate. Values are expressed as means ± SD. ∗p < 0.05 versus db/m group. ∗∗p < 0.01 versus db/m group. #p < 0.05 versus db/db group. ##p < 0.01 versus db/db group.
