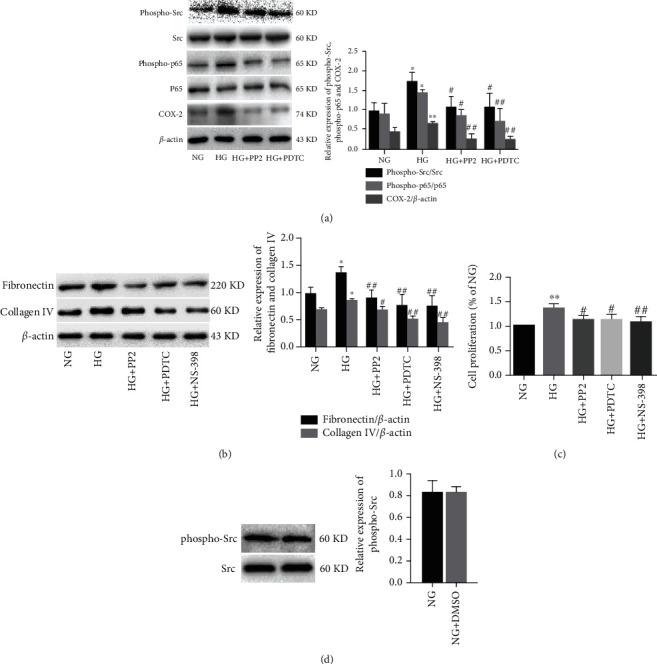
Figure 3.

Effect of c-Src inhibiton on HG-induced ECM accumulation in MMCs. (a) The expression levels of phospho-Src, Src, phospho-p65, p65, and COX-2 analyzed by western blotting. (b) The expression levels of fibronectin and collagen IV analyzed by western blotting. (c) Cell proliferation of MMCs detected by the MTT assay. (d) The expression levels of phospho-Src and Src analyzed by western blotting. All experiments were performed independently at least in triplicate. Values are expressed as means ± SD. ∗p < 0.05 versus NG group. ∗∗p < 0.01 versus NG group. #p < 0.05 versus HG group.##p < 0.01 versus HG group.
