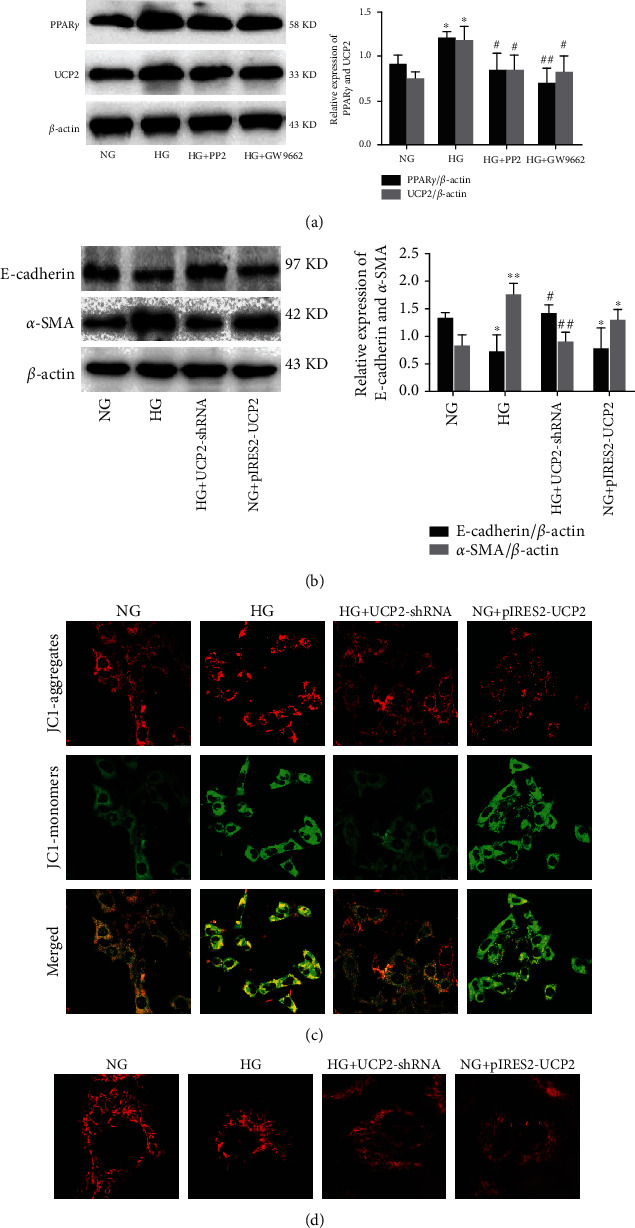
Figure 6.

Effect of c-Src inhibiton HG-induced EMT in HK-2 cells. (a) The expression levels of PPARγ and UCP2 analyzed by western blotting. (b) The expression levels of E-cadherin and α-SMA analyzed by western blotting. (c) MMP detected by the JC-1 membrane potential assay (magnification ×100). The shift of fluorescence from red to green after HG exposure indicates a decrease in mitochondria membrane potential. (d) The mitochondrial morphology detected by Mitotracker (magnification×400). All western blot experiments were performed independently at least in triplicate. Values are expressed as means ± SD. ∗p < 0.05 versus NG group. ∗∗p < 0.01 versus NG group. #p < 0.05 versus HG group.##p < 0.01 versus HG group.
