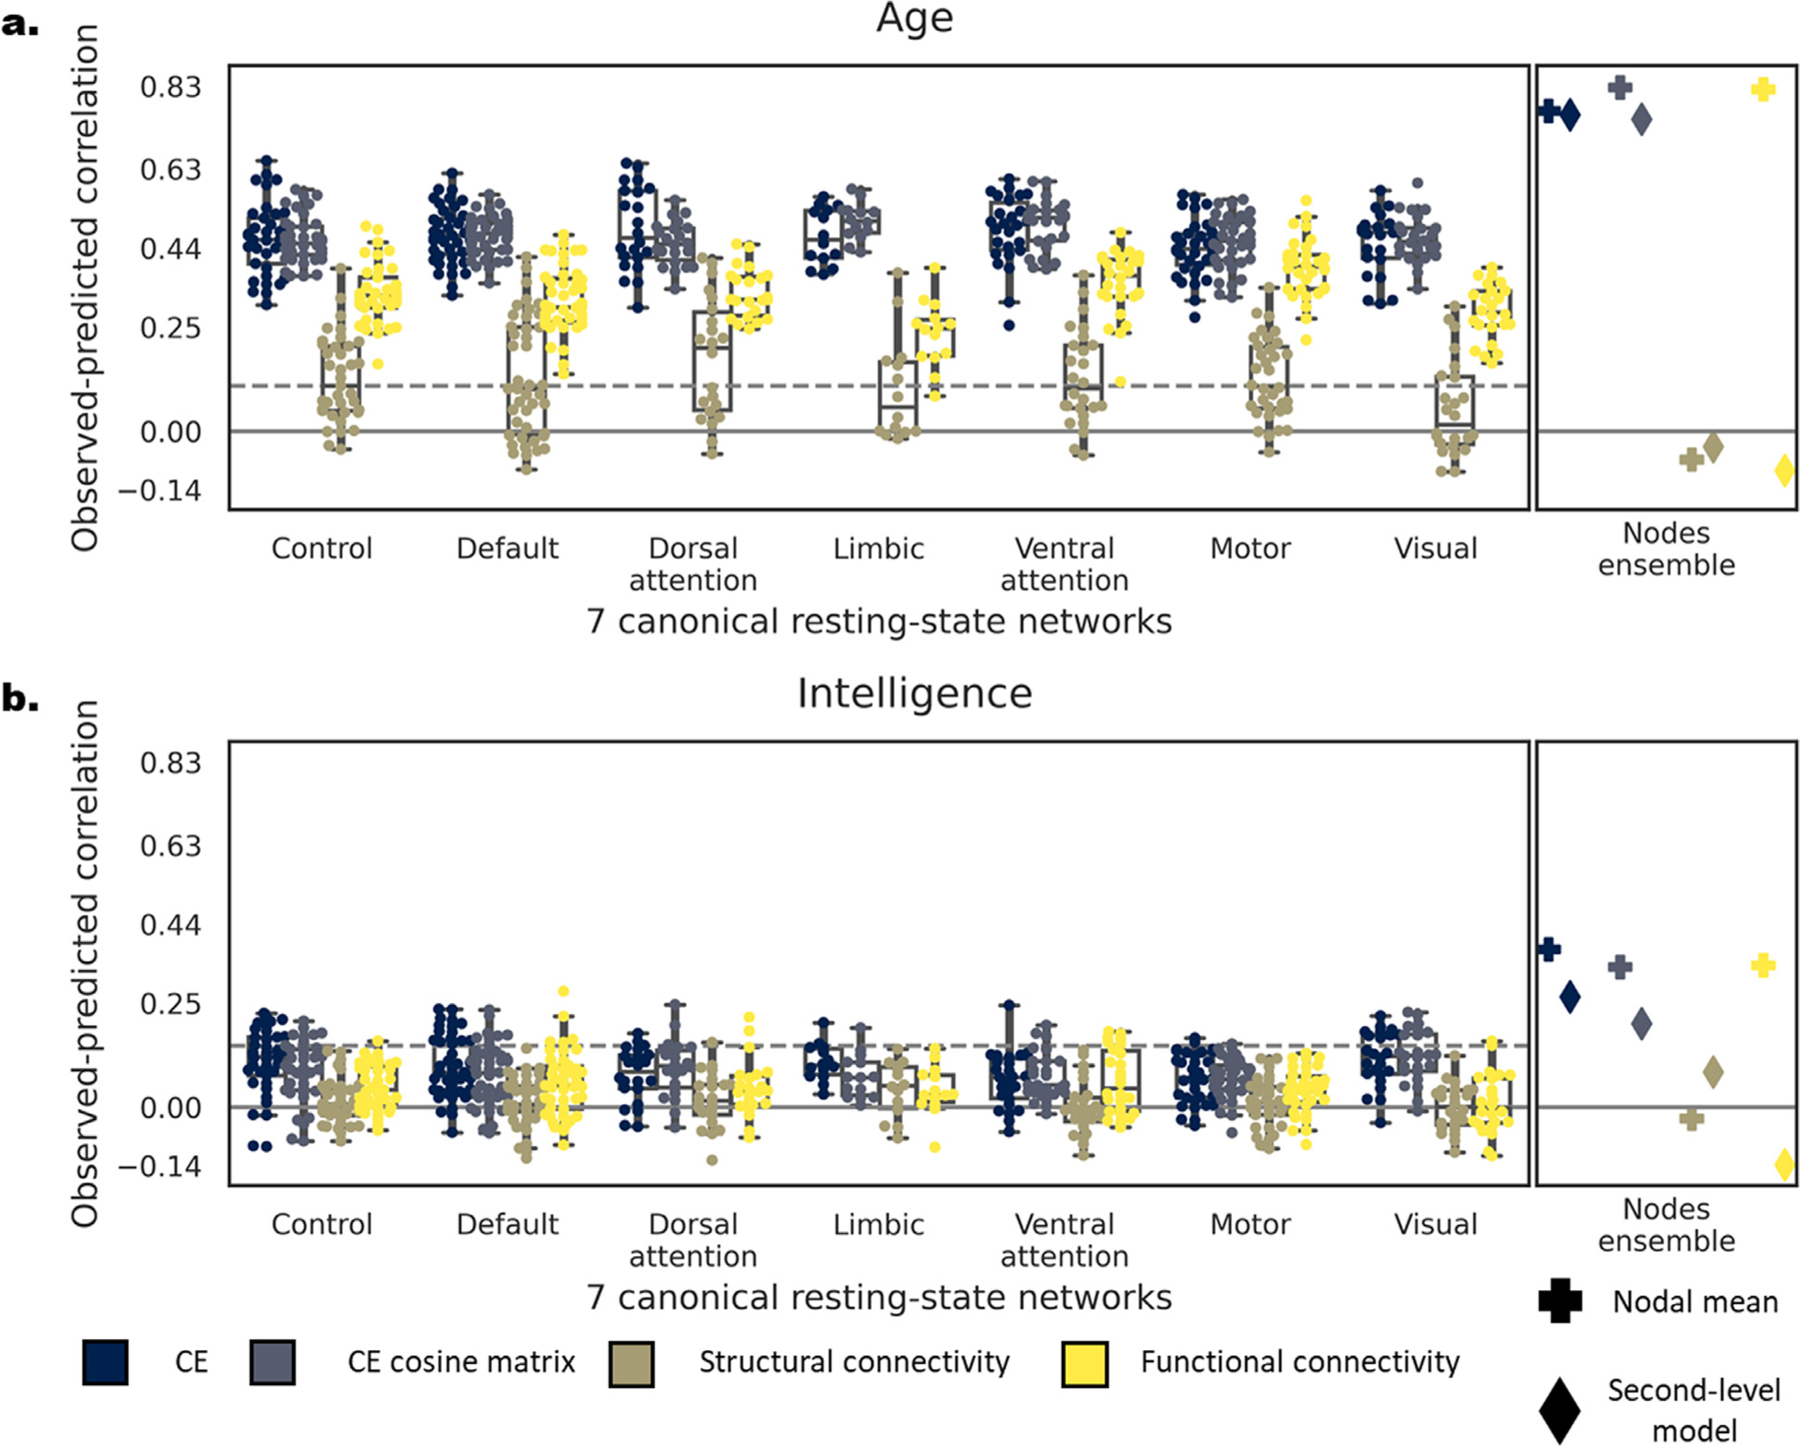
Fig. 6.

Comparing predictive accuracy of CE, CE cosine similarity matrix, structural and functional connectivity as input within DS1. Correlation between the observed and predicted age (a) and intelligence (b) with CE (blue), CE cosine matrix (blue-gray), structural (brown) and functional (yellow) connectivity (For interpretation of the references to color in this figure legend, the reader is referred to the web version of this article.). On the left panel of each subplot, dots represent the predictive accuracy of each node within each of the 7 resting state networks (Yeo et al., 2011). Nodes are grouped by their resting state network affiliation. The right panel depicts the predictive accuracy of a model combining all individual nodes by taking their mean (plus symbol) or aggregates them using a second-level linear model (diamond symbol). The dashed line represents the FDR-corrected significance level for single nodal prediction.
