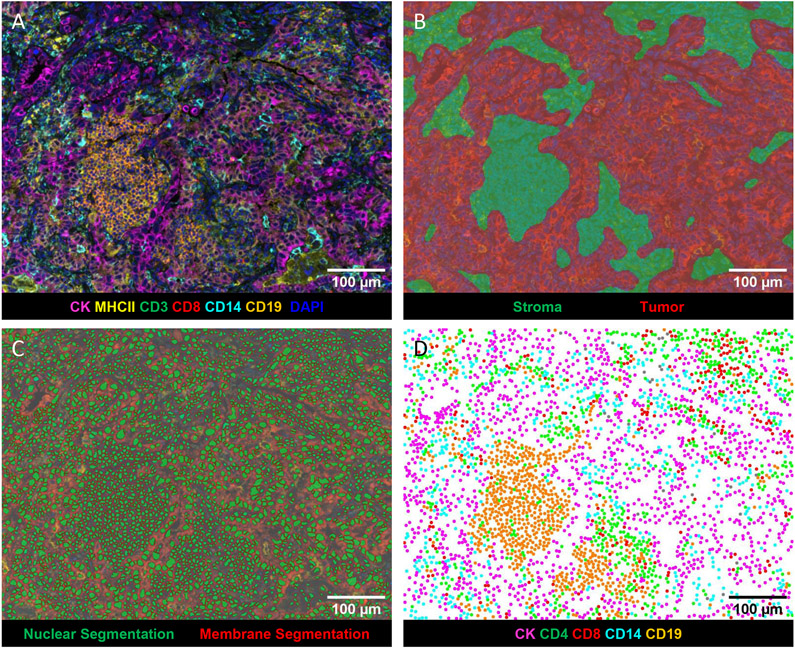
Figure 1: Representative images generated by inForm analysis.
A) Spectrally unmixed composite image: pan-cytokeratin (CK) (magenta), CD3 (green), CD8 (red), CD14 (turquoise), CD19 (orange), MHCII (yellow), and DAPI (blue). B) Tissue segmentation map of tumor (red), and stroma (green) regions. C) Cell segmentation map: nucleus (green) and membrane (outlined in red). D) Phenotype map of CK+ cancer cells (magenta), CD4+ (CD3+CD8−) T cells (green), CD8+ T cells (red), CD14+ cells (turquoise), CD19+ B cells (orange).

