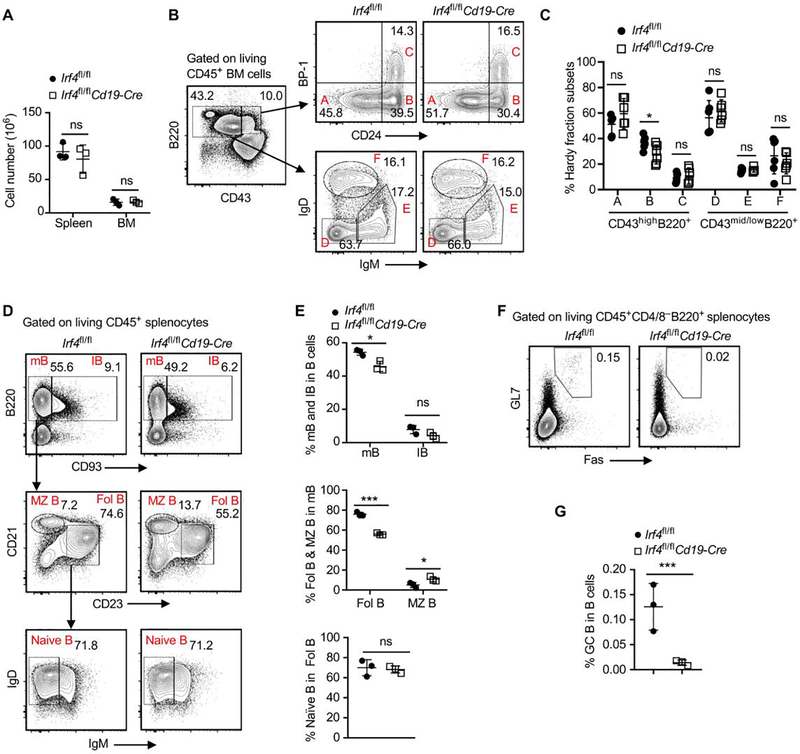
Figure 2. Ablation of IRF4 in B cells eliminates GC B cells.
Splenocytes and bone marrow (BM) cells were obtained from Irf4fl/flCd19-Cre or Irf4fl/fl control mice at 8 weeks of age, followed by flow cytometry analysis. (A) Total numbers of CD45+ splenocytes and femur BM cells in indicated mouse groups. Data are shown as mean ± SD and are from one experiment that is representative of two independent experiments. (B and C) Representative contour plots and the bar graph display % Hardy fraction subsets A to C in CD43highB220+ BM cells and % Hardy fraction subsets D to F in CD43mid/lowB220+ BM cells. Data in C are shown as mean ± SD and are from one experiment that is representative of two independent experiments. (D and E) Representative plots and bar graphs show % mB and IB cells in splenic B cells, % Fol B and MZ B cells in mB cells, and % naïve B cells in Fol B cells. (F and G) Representative plots and the bar graph show % GC B cells in CD45+CD4–CD8–B220+ splenic B cells. Data in E and G are shown as mean ± SD and are from one experiment that is representative of two independent experiments. ns, P > 0.05; *P < 0.05; ***P < 0.001 by unpaired Student’s t test.

