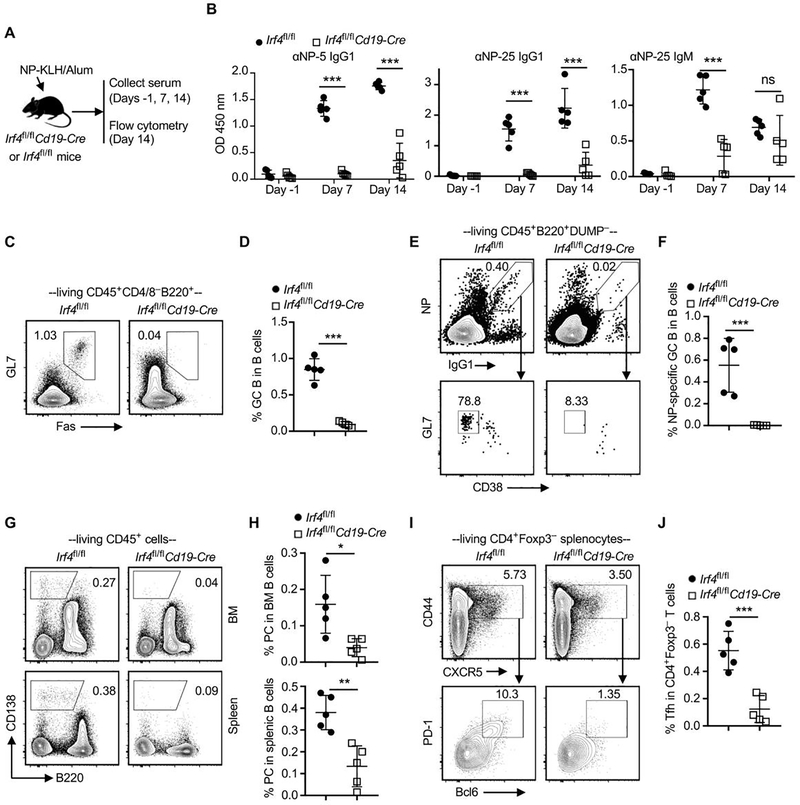
Figure 3. Ablation of IRF4 in B cells abrogates the production of antigen-specific antibody in response to NP-KLH immunization.
Irf4fl/fl control and Irf4fl/flCd19-Cre mice were immunized with NP-KLH in alum on day 0. Serum samples were collected on days −1, 7, and 14 for ELISA. Splenocytes and BM cells were obtained on day 14 for flow cytometry analysis. (A) Schematic of the experimental design. (B) Optical density (OD) values indicate the presence of anti-NP-5 (αNP-5) IgG1, anti-NP-25 (αNP-25) IgG1, and anti-NP-25 (αNP-25) IgM in sera of indicated recipient groups. Test sera were diluted 1:8100. (C and D) Representative contour plots and the bar graph show % Fas+GL7+ GC B cells in splenic B cells. (E and F) % NP-specific GC B cells (NP+IgG1+GL7+CD38–) in B220+DUMP– splenic B cells. DUMP includes antibodies against IgM, IgD, CD3, CD11b, CD11c, CD138, and Gr-1. (G and H) % CD138+B220– plasma cells (PC) in splenocytes and BM cells. (I and J) % CD44+CXCR5+PD-1+Bcl6+ Tfh cells in CD4+Foxp3– splenocytes. Data in B, D, F, H, and J are shown as mean ± SD (n = 5) and are from one experiment that is representative of two independent experiments. ns, P > 0.05; *P < 0.05; **P < 0.01; ***P < 0.001 by unpaired Student’s t test.

