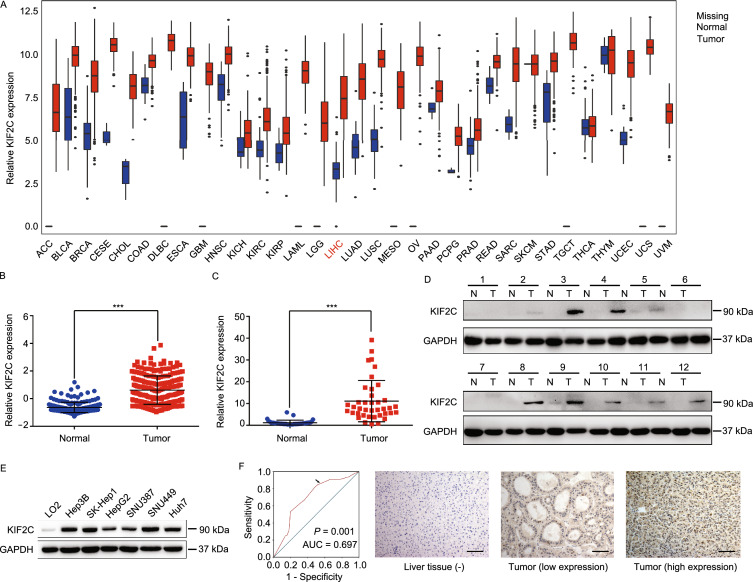
Figure 1.
KIF2C upregulation is frequently observed in HCC and correlates with a poor prognosis. (A) Expression of KIF2C mRNA in different cancers (tumor vs. corresponding normal tissues) was analyzed based on the data from The Cancer Genome Atlas project. ACC: adrenocortical carcinoma; BLCA: bladder urothelial carcinoma; BRCA: breast invasive carcinoma; CESE: cervical squamous cell carcinoma and endocervical adenocarcinoma; CHOL: cholangiocarcinoma; COAD: colon adenocarcinoma; DLBC: lymphoid neoplasm diffuse large B-cell lymphoma; ESCA: esophageal carcinoma; GBM: glioblastoma multiforme; HNSC: head and neck squamous cell carcinoma; KICH: kidney chromophobe; KIRC: kidney renal clear cell carcinoma; KIRP: kidney renal papillary cell carcinoma; LAML: acute myeloid leukemia; LGG: brain lower grade glioma; LIHC: liver hepatocellular carcinoma; LUAD: lung adenocarcinoma; LUSC: lung squamous cell carcinoma; MESO: mesothelioma; OV: ovarian serous cystadenocarcinoma; PAAD: pancreatic adenocarcinoma; PCPG: pheochromocytoma and paraganglioma; PRAD: prostate adenocarcinoma; READ: rectum adenocarcinoma; SARC: sarcoma; SKCM: skin cutaneous melanoma; STAD: stomach adenocarcinoma; TGCT: testicular germ cell tumors; THCA: thyroid carcinoma; THYM: thymoma; UCEC: uterine corpus endometrial carcinoma; UCS: uterine carcinosarcoma; UVM: uveal melanoma. (B) KIF2C mRNA expression from an OncoMine microarray data set, including 225 HCC and 220 normal liver tissues. Data are presented as the mean ± SD, ***P < 0.001, Student’s t-test. (C) qRT-PCR analysis of KIF2C mRNA expression in 39 paired HCC and adjacent non-tumor tissues. Data are presented as the mean ± SD of three independent experiments, ***P < 0.001, Student’s t-test. (D) Western blot analysis of the KIF2C protein expression levels in 12 pairs of HCC and adjacent normal tissues. (E) Expression of KIF2C in immortalized hepatocytes and HCC cell lines examined by Western blot. (F) Receiver operating characteristic curve analysis was performed to determine the cut-off score for the high expression of KIF2C (left panel). Representative immunohistochemical images show the expression pattern of KIF2C in the HCC and adjacent liver tissues (right panel). Scale bars, 100 μm. (G) Kaplan-Meier survival analysis of disease-free survival (DFS) or overall survival (OS) according to KIF2C expression in 149 patients with HCC (log-rank test). (H) Kaplan-Meier survival analysis of DFS or OS according to KIF2C expression from TCGA database in patients with HCC (log-rank test)


