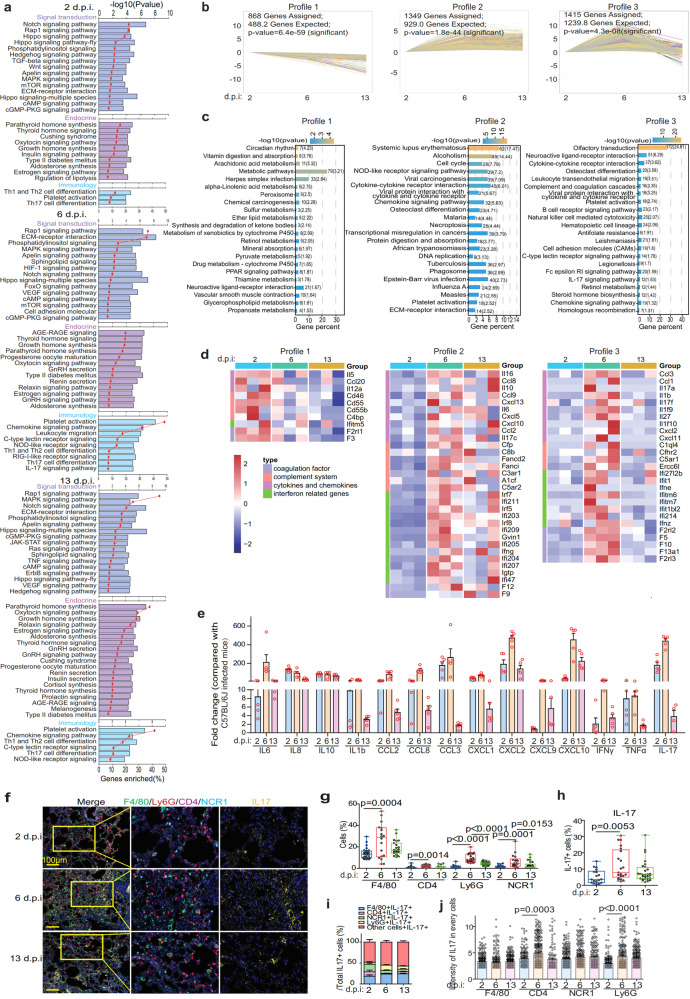
Fig. 3.
Immune characteristics of hCD147 mouse model with SARS-CoV-2 infection. a RNA-seq analysis of the lung homogenates of C57BL/6 J and hCD147 mice with SARS-CoV-2 infection at 2, 6, and 13 d.p.i. (n = 3). KEGG enrichment analysis of pathways enriched in differentially expressed genes. b The statistically significant profiles by trend analysis of differentially expressed genes at 2, 6, and 13 d.p.i. c KEGG enrichment analysis of pathways enriched in the three profiles. d Heatmap of significantly upregulated genes in the three profiles. Columns represent samples and rows represent genes. Gene expression levels in the heat maps are z score–normalized values determined by log2[CPM] values. e Fold change in the gene expression of the cytokines and chemokines determined by RT-qPCR, compared with C57BL/6 J controls in lung homogenates at 2, 6, and 13 d.p.i. Gapdh is used as a reference gene (n = 5). f Multiplex immunofluorescence staining of lung tissue sections for F4/80, CD4, Ly6G, NCR1, and IL-17 from hCD147 mice at 2, 6, and 13 d.p.i. (scale bars, 50 μm). g Statistics of the percentage of cells positive for F4/80, CD4, Ly6G, and NCR1 (Two-tailed student t test, each dot represents an image). h Statistics of the percentage of cells positive for IL-17 (Two-tailed student t test, each dot represents an image). i The composition of IL-17 positive cells in lung tissues at 2, 6, and 13 d.p.i. j The intensity of IL-17 on macrophages, CD4 + T cells, neutrophiles, and NK cells in lung tissues. Each dot represents a cell

