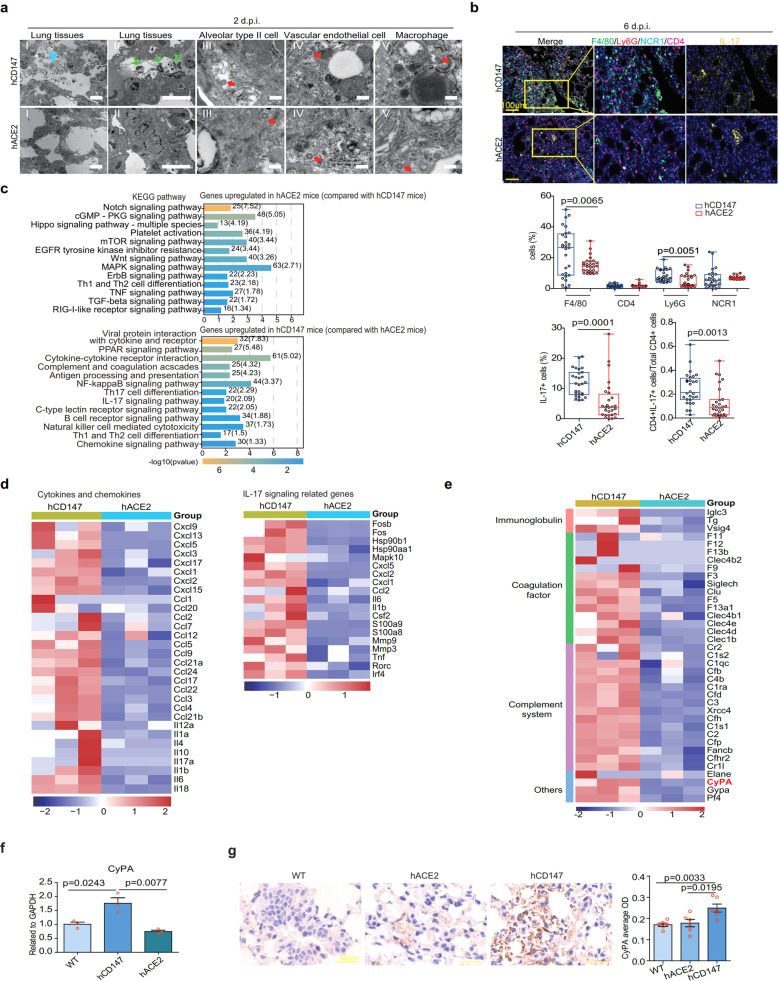
Fig. 4.
SARS-CoV-2 causes exudative alveolar pneumonia phenotypes and stronger immune responses in hCD147 mouse model compared with hACE2 mouse model. hACE2 and hCD147 mice were inoculated via the intranasal route with 3 × 10⁵ TCID50 of SARS-CoV-2. Lung tissues were collected at 2, 6, and 13 d.p.i. for pathological analysis. a Pathological changes in hACE2 and hCD147 mouse lung tissues (at 2 d.p.i.) were detected by electron microscopy (scale bars in panels I and II, 10 μm; scale bars in panels III–V, 200 nm). The cyan arrow indicates exudation; the green arrows indicate infiltration of macrophages, neutrophils, and erythrocytes; the red arrows indicate virions. b Multiplex immunofluorescence staining for CD4, F4/80, Ly6G, NCR1, and IL-17 at 6 d.p.i. by SARS-CoV-2, and statistics of the percentages of cells positive for CD4, F4/80, Ly6G, NCR1, and IL-17 (Each dot represents an image, Two-tailed student t test). c KEGG enrichment analysis of pathways enriched in upregulated differentially expressed genes in SARS-CoV-2-infected hACE2 mice and hCD147 mice at 2 d.p.i. d Heatmap of significantly upregulated cytokines, chemokines, IL-17 signaling-related genes in lung homogenates of SARS-CoV-2-infected hCD147 mice compared with SARS-CoV-2-infected hACE2 mice. e Heatmap of immune-related genes (except cytokines and chemokines) in lung homogenates of SARS-CoV-2-infected hCD147 mice compared with SARS-CoV-2-infected hACE2 mice. Columns represent samples and rows represent genes. Gene expression levels in the heat maps are z score–normalized values determined by log2[CPM] values. f RT-qPCR for CyPA levels in lung homogenates of SARS-CoV-2-infected C57BL/6 J, hACE2, and hCD147 mice (n = 3, two-tailed unpaired t test). g Detection of CyPA expression in lung tissues from SARS-CoV-2-infected C57BL/6 J, hACE2, and hCD147 mice by immunohistochemical staining

