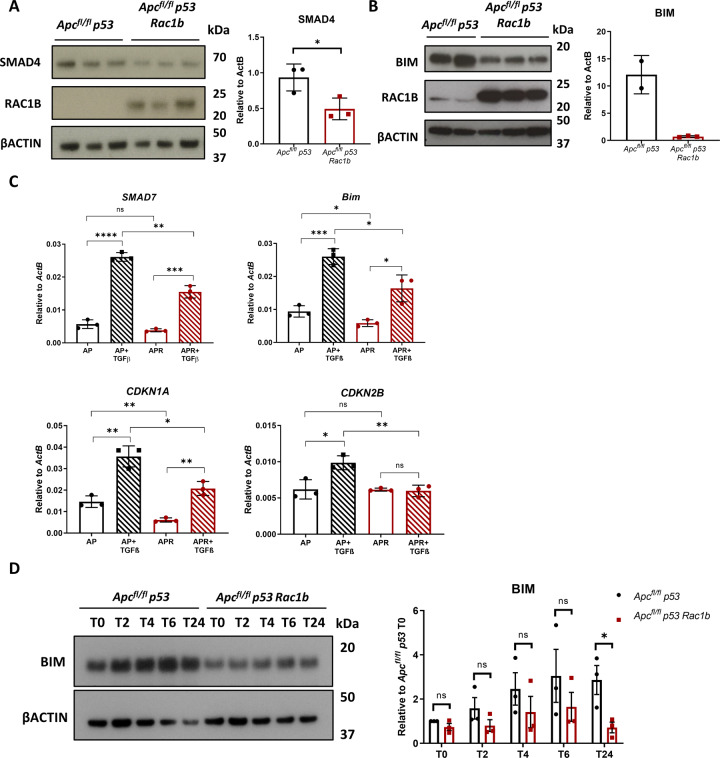
Fig. 5. Overexpression of RAC1B impairs TGFβ pathway activation.
A Western blot analysis of Apcfl/fl p53 and Apcfl/fl p53 Rac1b organoids for SMAD4, RAC1B and βACTIN. Graph shows SMAD4 band densitometry quantification relative to βACTIN (error bars represent SD; *P = 0.034; two tailed t test, n = 3vs3). B Western blot analysis of Apcfl/fl p53 and Apcfl/fl p53 Rac1b epithelial extractions for BIM, RAC1B and βACTIN. C qRT-PCR analysis of SMAD7, BIM, CDKN1A and CDKN2B of Apcfl/fl p53 and Apcfl/fl p53 Rac1b organoids after 2 h treatment with 5 ng/ml TGFβ (error bars represent SD; n.s. P ≥ 0.05, *P < 0.05, **P < 0.01, ***P < 0.001, ****P < 0.0001; two tailed t test, n = 3vs3). D Western blot analysis for BIM and βACTIN of Apcfl/fl p53 and Apcfl/fl p53 Rac1b organoids treated with 5 ng/ml TGFβ at baseline (T0), two (T2), four (T4), six (T6) and twenty-four (T24) hours. Graph represents BIM band densitometry quantification relative to βACTIN. Quantification is normalised to the expression of Apcfl/fl p53 at T0 (error bars represent SD; n.s. P ≥ 0.05, *P < 0.05; two tailed t test, n = 3vs3).

