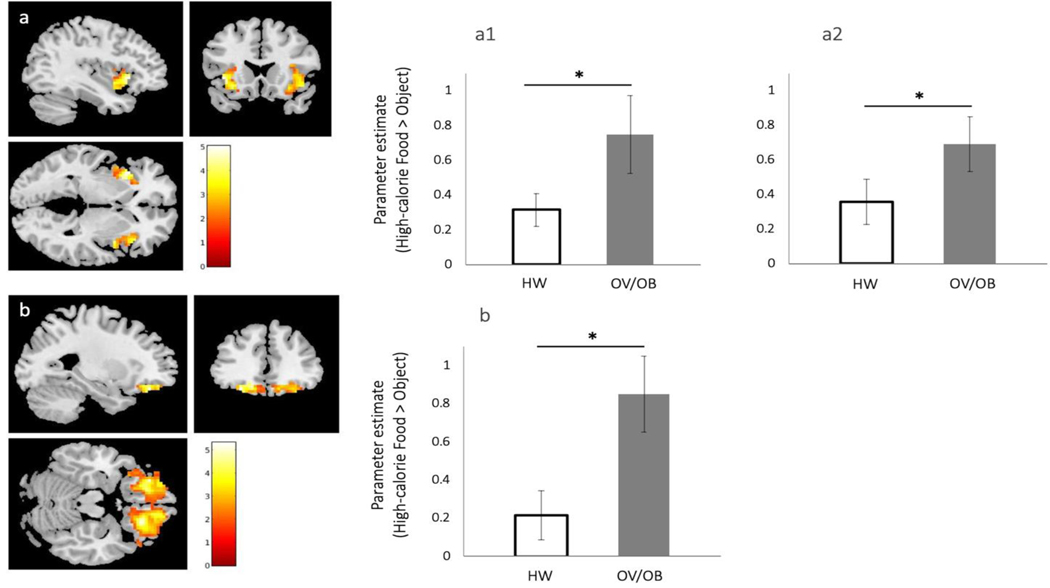
Figure 1. BOLD response to high-calorie vs. non-food objects in participants with ARFID and overweight/obesity compared with ARFID and healthy weight.
For each ROI, figures show SPM maps of BOLD activation at pFWE<0.05 in response to high-calorie food images vs. non-food objects. The right panel depicts bar graphs with error bars (indicating SEM) for the mean parameter estimates extracted from the ROI cluster for each group (participants with ARFID and overweight/obesity, OV/OB; and participants with ARFID and healthy weight, HW). For p-values and AAL3 coordinates see Table 4. (a) Anterior insula, aINS (a1, right aINS; a2, left aINS); (b) left OFC (cluster spans both hemispheres with maximum voxel corresponding to the left hemisphere).

