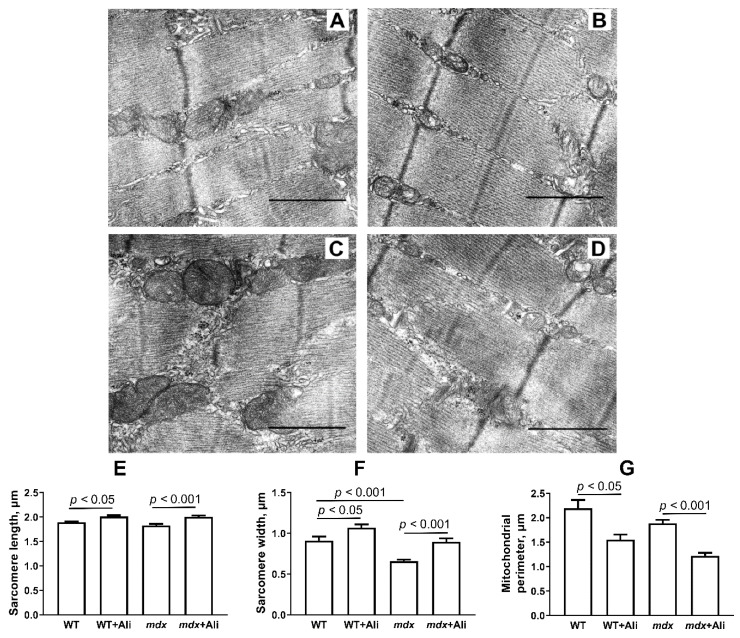
Figure 4.
Representative electron micrographs of skeletal muscle tissue (quadriceps) from WT (A), WT+Ali (B), mdx (C), and mdx+Ali (D) groups of mice. The bar is equal to 1 μm. Graphical representation of micrograph profiles: sarcomere length in μm (E), sarcomere width in μm (F), and mitochondrial perimeter in μm (G). The number of examined fields of view in the groups varies from 40 to 50.

