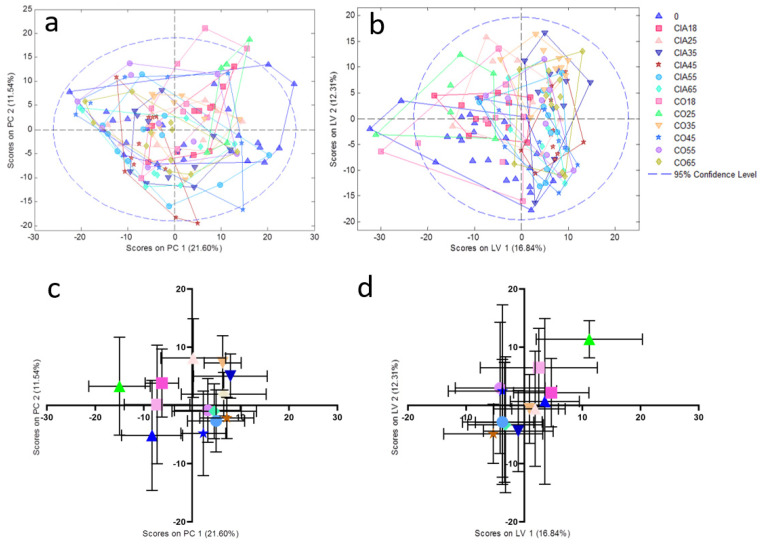
Figure 1.
PCA (a) and PLSDA (b) analysis of CIA and CO groups with all-time points. (c) and (d) represent the plotted data in mean ± standard deviation of the mean from PCA and PLSDA analysis, respectively. 0: all animals before the beginning of the experiment (blue triangle); CIA18: CIA group 18 days after disease induction (pink square); CIA25: CIA group 25 days after disease induction (light pink triangle); CIA35: CIA group 35 days after disease induction (dark blue inverted triangle); CIA45: CIA group 45 days after disease induction (red star); CIA55: CIA group 55 days after disease induction (light blue circle); CIA65: CIA group 65 days after disease induction (light blue diamond); CO18: CO group 18 days after the experiment beginning of the (light pink square); CO25: CO group 25 days after the beginning of the experiment (green triangle); CO35: CO group 35 days after the beginning of the experiment (orange inverted triangle); CO45: CO group 45 days after the beginning of the experiment (blue star); CO 55: CO group 55 days after the beginning of the experiment (purple circle); CO65: CO group 65 days after the beginning of the experiment (yellow diamond). PC: principal component; LV: latent variable.

