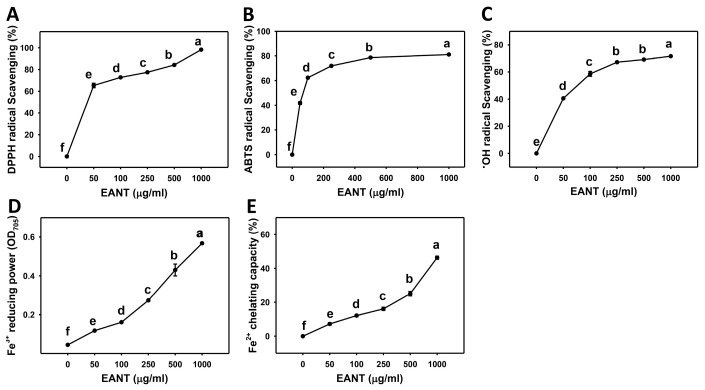
Figure 1.
Concentration effect of EANT on the scavenging activities of DPPH, ABTS, and hydroxyl radical (•OH), as well as FRAP and FCP statuses. The concentration of EANT was shown as indicated in each panel (A–E). Data, mean ± SD (n = 3). For multiple comparisons, data without the same letters reveal a significant difference (p < 0.05–0.0001). For example (Figure 1C), the •OH radical scavenging (%) at 250 and 500 μg/mL EANT show “b and b” indicating nonsignificant differences between each other because they overlap with the same lower-case letters. Similarly, the •OH radical scavenging (%) at 50 and 250 μg/mL EANT showing “d” and “b” indicate significant differences among each other.

