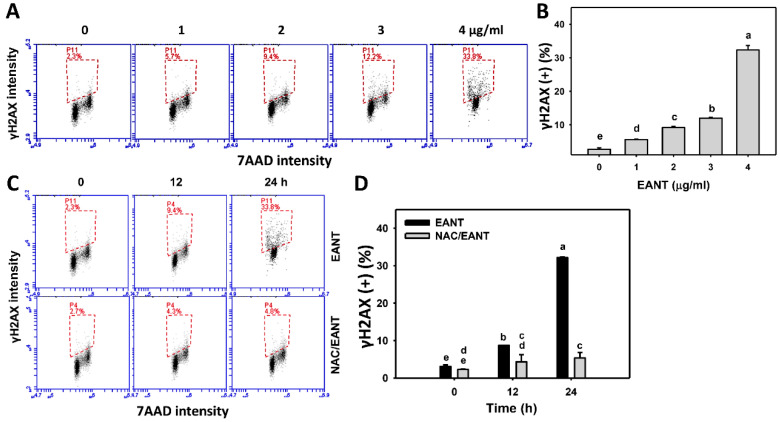
Figure 9.
γH2AX content of EANT-treated leukemia cells. (A,B) Histogram and statistical analysis for γH2AX content. The dash-lined region of each panel is regarded as the population of γH2AX (+) (%). HL-60 cells were treated with EANT (1 h, 0 to 4 μg/mL). The control contained 0 μg/mL EANT but 0.1% DMSO. (C,D) Histogram and statistical analysis for γH2AX content of HL-60 cells following NAC/EANT treatment. NAC/EANT indicates that cells were either pretreated with NAC (5 mM, 1 h) or post-treated with EANT (0 and 4 μg/mL for 0, 12, and 24 h). Data, mean ± SD (n = 3). Data showing different alphabets at the top reveal a significant difference (p < 0.05–0.0001 for multiple comparisons).

