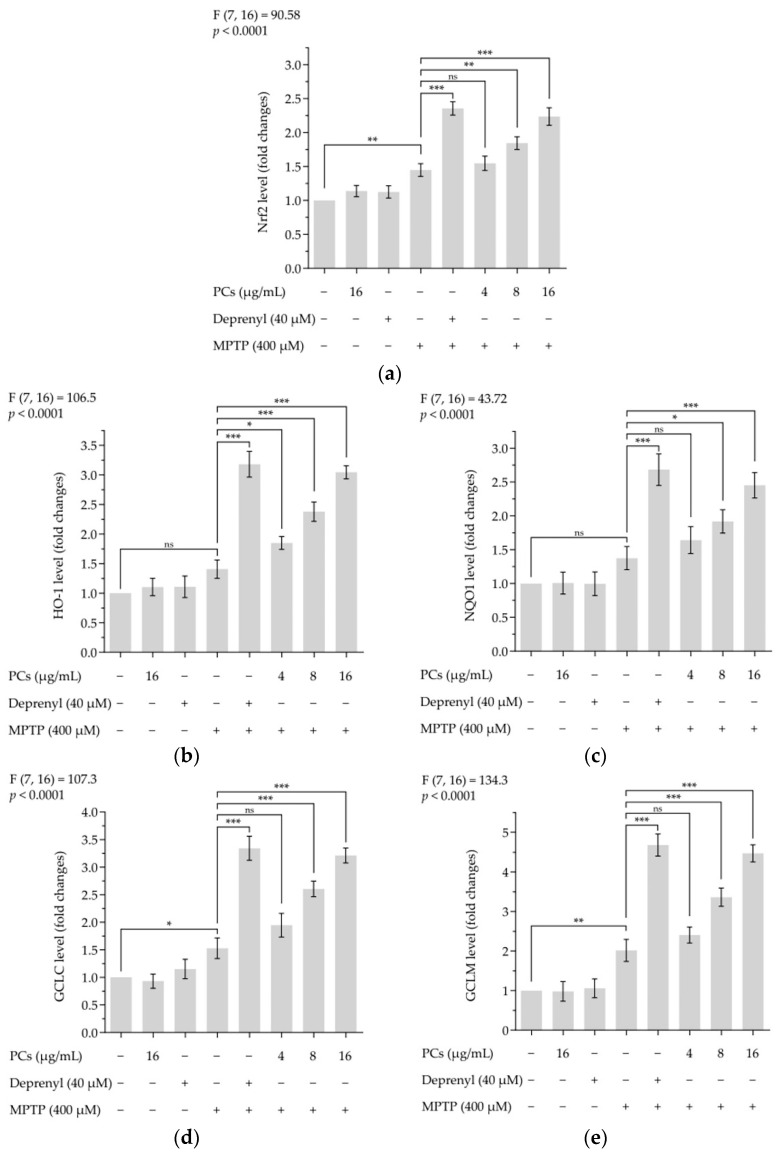
Figure 8.
Effects of PCs on Nrf2/ARE pathway in MPTP-induced zebrafish larvae. (a) Nrf2 levels; (b) HO-1 levels; (c) NQO1 levels; (d) GCLC levels; (e) GCLM levels. F and p values of the one-way analysis of variance are presented above each chart. The results of Tukey’s post hoc test are presented for selected comparisons: ns, p > 0.05; *, p < 0.05; **, p < 0.01; ***, p < 0.001; the error bars are SD.

