Figure 5.
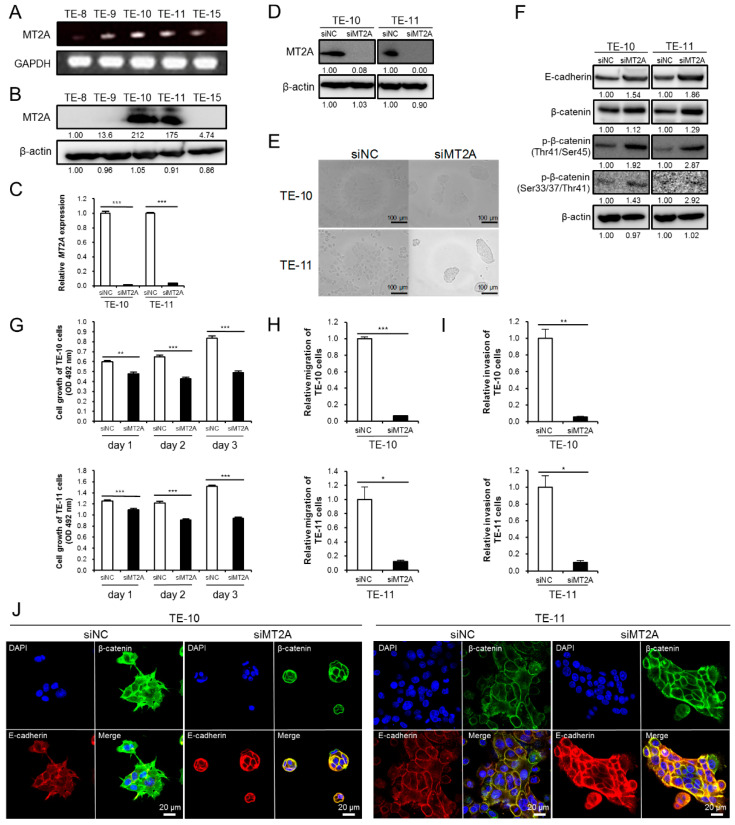
The high expression of MT2A in ESCC cells promoted their growth, migration, and invasiveness, possibly due to the downregulation of E-cadherin. (A) Expression of MT2A mRNA in five ESCC cell lines, TE-8, TE-9, TE-10, TE-11, and TE-15, evaluated by RT-PCR. GAPDH was used as the internal control. (B) Western blotting to confirm the expression of MT2A protein in the five ESCC cell lines. (C,D) TE-10 and TE-11 were transfected with siRNA against MT2A (siMT2A) and control siRNA (siNC). MT2A knockdown was confirmed by qRT-PCR (C) and Western blotting (D) in TE-10 and TE-11. After Western blotting, the normalized relative expression fold-change was calculated using the ImageJ software, and the values were arbitrarily set as 1.00 for the cells transfected with siNC. (E) Changes in the cell morphology of ESCC cell lines transfected with siNC or siMT2A under a phase contrast microscope. (F) Western blotting for expression levels of E-cadherin and phosphorylation levels of β-catenin in siMT2A-treated TE-10 and TE-11 cells, compared with those in cells treated with siNC. The normalized relative expression fold-change was calculated using the ImageJ software, and the values were arbitrarily set as 1.00 for cells transfected with siNC. (G) MTS assay for cell growth in TE-10 and TE-11 cells treated with siMT2A or siNC. Each ESCC cell line transfected with siNC and siMT2A was seeded in 96-well plates at 5 × 10³ cells per well with RPMI-1640 + 1% FBS. The cell growth was evaluated after 24, 48, and 72 h. (H,I) Transwell migration (H) and invasion (I) assay of ESCC cell lines transfected with siNC and siMT2A. (J) Double immunofluorescence was performed using anti-β-catenin (green) and anti-E-cadherin (red) antibodies in the ESCC cell lines transfected with siNC and siMT2A. Cell nuclei were stained with DAPI (blue). Data are presented as mean ± SEM (* p < 0.05, ** p < 0.01, *** p < 0.001).

