Figure 5.
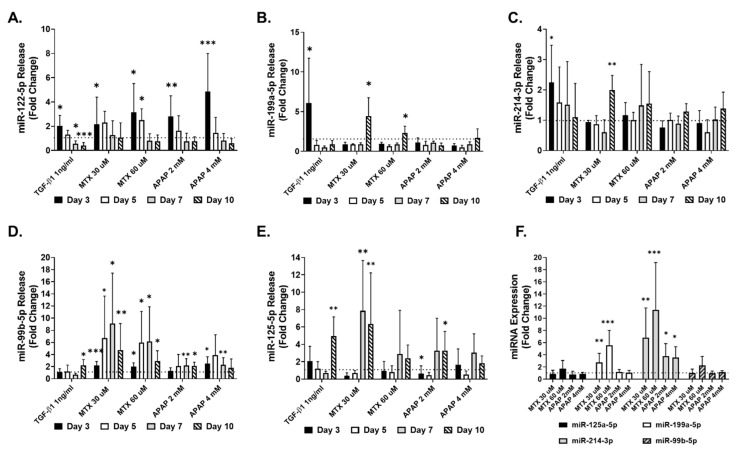
miRNA corroboration using q-RT-PCR. MTs were exposed to TGF-β1, MTX or APAP for 10 days and cell culture supernatant was collected to investigate miRNA release using q-RT-PCR. Release of miR-122-5p (A), miR-199a-5p (B), miR-214-3p (C), miR-99b-5p (D) and miR-125a-5p (E) was measured at day 3, day 5, day 7 and day 10, and analyzed using q-RT-PCR. miRNA was also measured intracellularly to assess changes in miR-125a-5p, miR-199a-5p, miR-214-3p and miR-99b-5p expression at day 10 (F). Data are expressed as fold change compared to untreated control (fold change 1); n = 9 for A, C, D and E. Bar graphs represent means ± SD; statistical analysis based on Student’s unpaired t test; *, p ≤ 0.05; **, p ≤ 0.01; ***, p ≤ 0.001.

