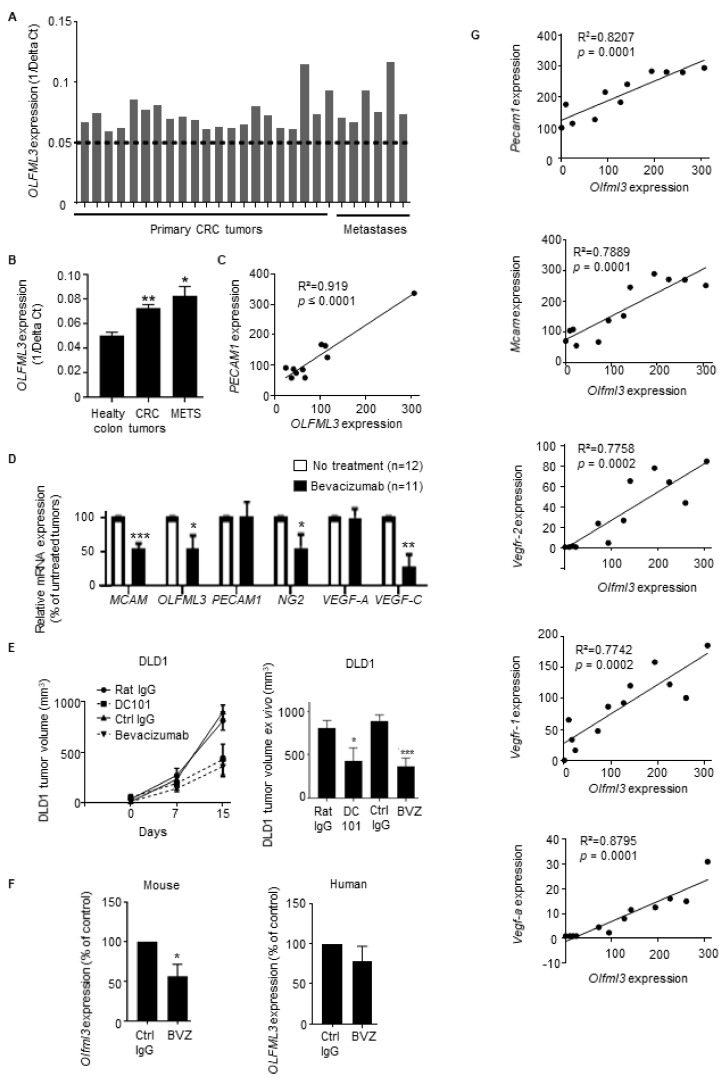
Figure 2.
Expression of OLFML3 mRNA in primary CRC tissues, patient-derived xenografts (PDXs), and tumor transplantation models correlates with that of angiogenic factors and decreases after anti-VEGF therapy. (A) Relative expression of OLFML3 mRNA in PDX samples derived from primary CRC tumors (n = 21) or CRC metastatic lesions (n = 6) relative to the average expression level in healthy colon tissue (dotted line), as determined by qRT-PCR. The average CT value was calculated for both OLFML3 and the housekeeping gene EEF1; delta CT (CT, OLFML3-CT, EEF1) was determined. (B) Relative mean OLFML3 mRNA levels in the tissues described in (A). (C) Scatter plots with linear regression lines (black) showing the correlation between the expression of Olfml3 and PECAM1 mRNA in PDX samples (n = 10), as determined by NanoString mRNA expression arrays. (D) Relative expression of mRNA encoding OLFML3 and angiogenic factors in tumor biopsies from CRC patients treated (n = 11) or not (n = 12) with bevacizumab, as determined by NanoString mRNA expression arrays. Results are normalized against values in nontreated patients. Bars represent the means ± SEM. (E) Growth of subcutaneous DLD1 xenografts (left) and size of excised tumors at the time of sacrifice (right) in immunodeficient NSG mice treated with an antihuman VEGF-A blocking mAb (bevacizumab), DC101, or the corresponding control IgG mAbs (n = 6 mice per group). (F) Relative expression of mRNA encoding mouse Olfml3 (left) and human OLFML3 (right) in human DLD1 CRC tumor samples from NSG mice treated with either bevacizumab (n = 6) or control IgG (n = 6). Results are normalized against the values in nontreated mice. Bars represent the mean ± SEM; * p < 0.05. (G) Scatter plot with linear regression lines (black) showing the correlation between NanoString mRNA expression profiles of Olfml3 and levels of transcripts encoding mouse angiogenic factors (Pecam1, Mcam, Vegfr-2, Vegfr-1, and Vegf-a) in DLD1 tumor extracts (n = 12), as determined by Pearson’s and Spearman’s rank correlation analyses. Differences between the groups were evaluated using the Mann–Whitney or unpaired Student’s t-test. Bars represent the mean ± SEM; * p < 0.05; ** p < 0.01; *** p < 0.01.

