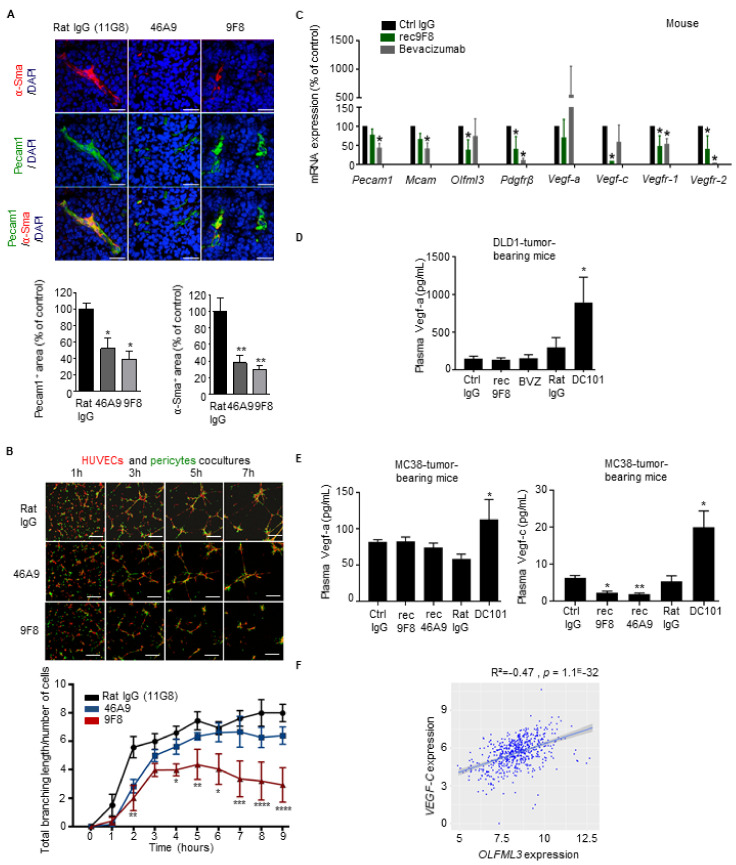
Figure 4.
Anti-OLFML3 antibody treatment decreases vascularization, pericyte coverage, and expression of angiogenesis-associated factors in colorectal and lung tumors. (A) Vascularization of LLC1 lung tumors. Upper panel: representative confocal images comparing α-Sma+ pericytes (red), Pecam1+ endothelium (green), and Pecam1+/α-SMA+ double staining (green and red) in LLC1 tumors grown in mice treated with isotype control rat IgG (11G8) or the anti-Olfml3 antibodies 46A9 or 9F8. DAPI (blue), nuclear counterstain. Bars, 100 µm. Lower panels: quantification of vessel density, expressed as the ratio of the total pixel count for Pecam1 to that for DAPI, normalized against control rat IgG (left). Quantification of pericyte density expressed as the ratio of total pixel count for α-Sma to that for DAPI, normalized against control rat IgG (right). Ten individual images of tumors, taken in three planes, were analyzed (five mice per group). Error bars represent ± SEM; * p < 0.05; ** p < 0.01. (B) Coculture of HUVECs with human brain pericytes. Upper panel: representative confocal images taken at the indicated times after seeding of cocultures of HUVECs (red) and human brain pericytes (green) in 3D Matrigel in the presence of 9F8, 46A9, or rat control mAbs. Lower panel: quantification of total branch length of capillary-like networks. Results represent the mean value ± SEM (three experiments, each group analyzed in triplicate); * p < 0.05; ** p < 0.01;*** p < 0.001; **** p < 0.0001. (C) Expression profile of mouse mRNA expression using NanoString arrays of DLD1 CRC tumors. Angiogenic factors in DLD1 tumors from mice treated with rec9F8, bevacizumab, or control IgG mAbs. Results are normalized against the values for control IgG-treated tumors. Columns represent the mean ± SEM (three experiments); * p < 0.05. (D,E) ELISA measurement of angiogenesis-associated factors in plasma of tumor-bearing mice. (D) Vegf-a in mice bearing DLD1 human CRC tumors treated with rec9F8, bevacizumab, DC101, or the corresponding control IgG antibodies (Ctrl IgG, Rat IgG). (E) Quantification of Vegf-a or Vegf-c in mice bearing MC38 mouse CRC tumors treated with rec9F8, rec46A9, DC101, or control IgG antibodies. (F) Scatter plots with linear regression lines (blue) showing the correlation among the NanoString mRNA expression profiles of OLFML3 and VEGF-C mRNA levels in tumor samples from CRC patients, calculated using Pearson’s and Spearman’s rank correlation analyses. Differences between groups were determined using an unpaired Student’s t-test.

