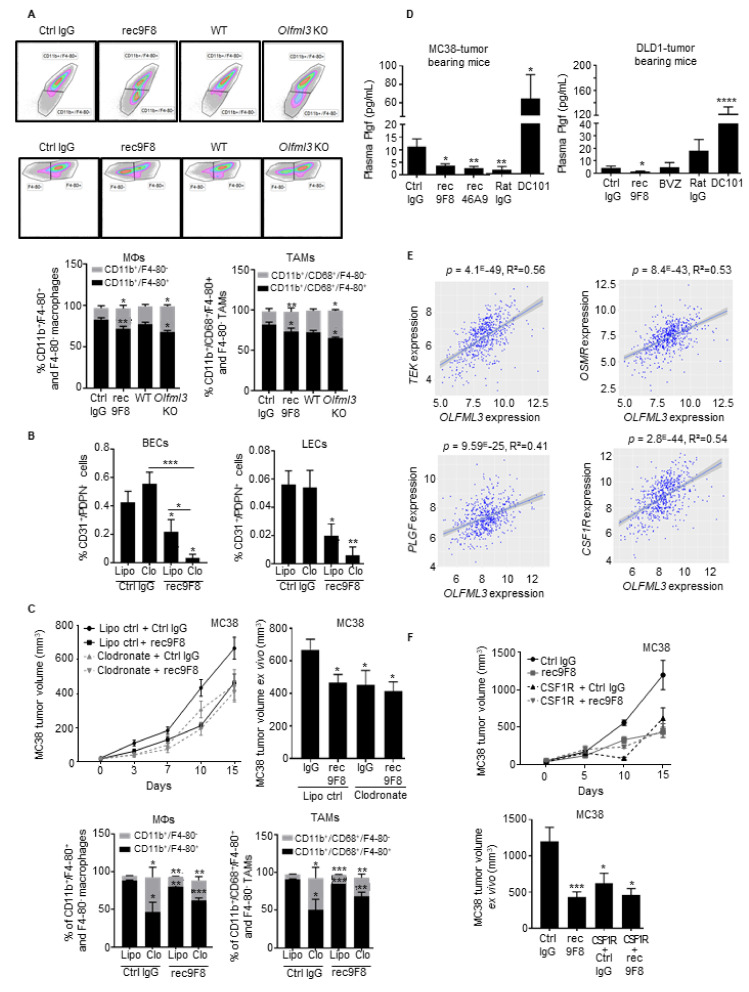
Figure 5.
Anti-OLFML3 antibodies or deletion of Olfml3 from mice reduces the percentage of tumor-associated macrophages (TAMs) in MC38 tumors. (A) Upper panel: flow cytometry gating strategy for immature and mature macrophages (upper plot) and TAMs (lower plot) in single-cell suspensions of MC38 tumors in wild-type (WT) mice treated with control or rec9F8 antibodies, or in Olfml3 WT or KO mice. Lower panel: quantification of immature (CD11b+/F4-80−) and mature (CD11b+/F4-80+) macrophages (left) and immature (CD11b+/CD68+/F4-80−) and mature (CD11b+/CD68+/F4-80+) TAMs (right). Columns represent the percentage of cells, and error bars represent the mean ± SEM; * p < 0.01; ** p < 0.01. (B) Quantification of blood vascular (BECs; CD31+/PDPN−) and lymphatic (LECs; CD31+/PDPN+) endothelial cells in MC38 tumors isolated from mice treated with clodronate-loaded liposomes, rec9F8 mAbs, and their respective controls. Columns represent the mean ± SEM; bars (right), * p < 0.05; ** p < 0.01; *** p < 0.001. (C) Growth curves (left) and size of ex vivo MC38 tumors at the end of the experiment (right) from mice treated with rec9F8 mAb alone or in combination with clodronate-loaded liposomes, control liposomes, or control mAbs (n = 8–11 per group). Lower panels: Quantification of immature (CD11b+/F4-80−) and mature (CD11b+/F4-80+) macrophages (left) and immature (CD11b+/CD68+/F4-80−) and mature (CD11b+/CD68+/F4-80+) TAMs (right) in MC38 tumors isolated from mice treated with clodronate-loaded liposomes, rec9F8, and their respective controls. Bars (right) represent the mean ± SEM; * p < 0.05; ** p < 0.01; *** p < 0.001. (D) Quantification of Plgf plasma levels in mice bearing DLD1 tumors treated with rec9F8, bevacizumab, DC101, or the corresponding IgG control mAbs (Ctrl IgG, Rat IgG) (right), and in mice harboring MC38 tumors treated with rec9F8, rec46A9, DC101, or the corresponding control IgG antibodies (left). Bars represent the mean ± SEM of three experiments; * p < 0.05; ** p < 0.01; **** p < 0.0001. (E) Scatter plot comparing mRNA levels of TEK, OSMR, PLGF, and CSF1R with those of OLFML3 in tumor samples from CRC patients. Differences were evaluated using Pearson’s correlation and Spearman’s rank correlation analysis. (F) Tumor growth curves (upper panel) and ex vivo tumor volume (lower panel) of end-stage MC38 tumors isolated from mice treated with rec9F8 mAb alone or with rec9F8 mAb plus an anti-CSF1-R blocking mAb (n = 8–10 per group). Bars represent the mean ± SEM; * p < 0.05; *** p < 0.001.

