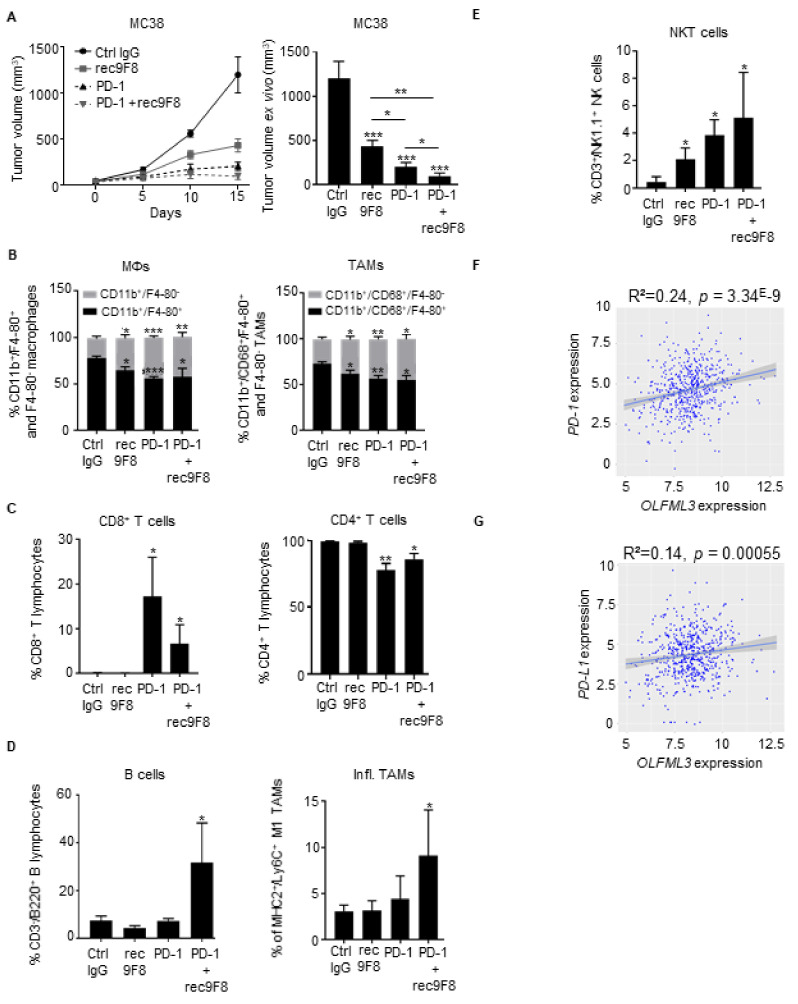
Figure 6.
Anti-OLFML3 mAb treatment increases the antitumor effects of anti-PD-1 immunotherapy. (A) Growth curve (left) and ex vivo size of MC38 tumors isolated from mice treated with rec9F8 or PD-1 alone or a combination of rec9F8 and anti-PD-1 mAbs at the end of the experiment (right) (n = 6–8 per group). Bars (right) represent the mean ± SEM; * p < 0.05; ** p < 0.01; *** p < 0.001. (B) Flow cytometry quantification of immature (CD11b+/F4-80−) and mature (CD11b+/F4-80+) macrophages (left) and immature (CD11b+/CD68+/F4-80−) and mature (CD11b+/CD68+/F4-80+) TAMs (right) in MC38 tumors isolated from mice treated with control IgG, anti-PD-1, rec9F8, or anti-PD-1 mAbs plus rec9F8. Bars (right) represent the mean ± SEM; * p < 0.05; ** p < 0.01; *** p < 0.001. (C) Flow cytometry quantification of intratumoral infiltration of (left) CD8+ T lymphocytes (CD45+/CD3+/CD8+) and (right) CD4+ T lymphocytes (CD45+/CD3+/CD4+). Bars represent the mean ± SEM; * p < 0.05; ** p < 0.01. (D) Flow cytometry quantification of intratumoral infiltration by (left) B lymphocytes (CD45+/CD3−/B220+) and (right) inflammatory macrophages isolated from mice bearing MC38 tumors treated with rec9F8 and anti-PD-1 mAbs, either alone or in combination as indicated. Bars represent the mean ± SEM; * p < 0.05. (E) Flow cytometry quantification of intratumoral infiltration by NKT cells (CD45+/CD3+/NK1.1+). Bars represent the mean ± SEM; * p < 0.05. (F,G) Scatter plots with linear regression lines comparing the mRNA levels of PD-1 (F) and PD-L1 (G) with that of OLFML3 in tumor samples from CRC patients. Differences were evaluated using Pearson’s correlation and Spearman’s rank correlation analyses.

