Figure 1.
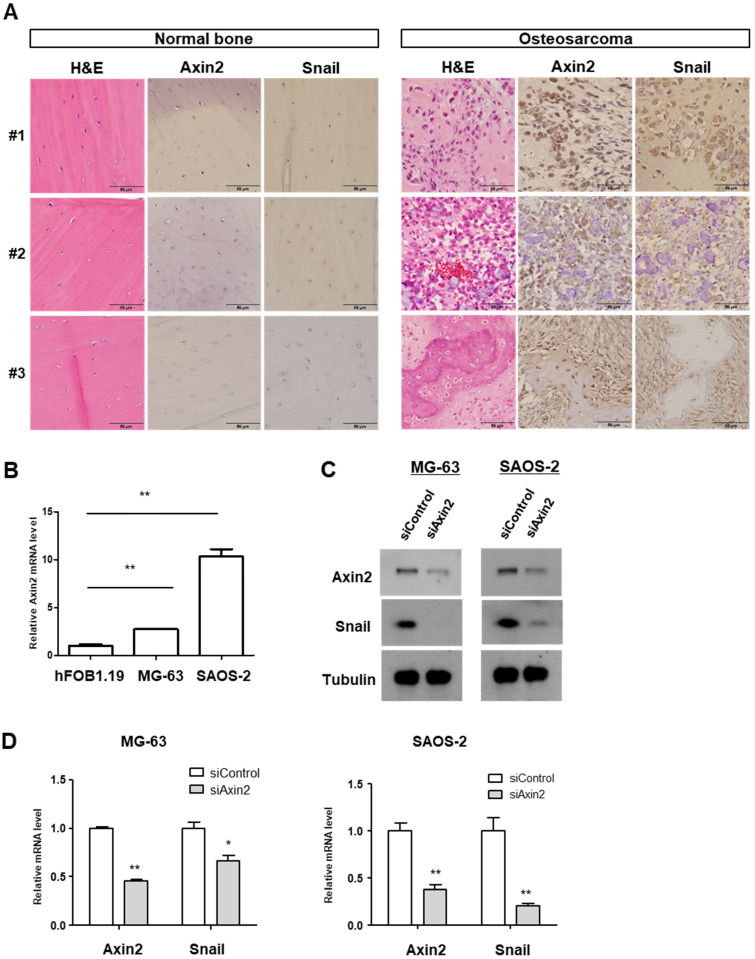
Axin2 and Snail are highly expressed in clinical tissue samples and cells of osteosarcoma. (A) Routine H&E staining and Axin2 and Snail immunohistochemical staining in adjacent normal bones (let panel) and tumor samples (right panel) in three patients with osteosarcoma. Photomicrographs were obtained at ×400 magnification. Scale bar = 50 µm. (B) The Axin2 mRNA levels of osteosarcoma cell line (MG-63, SAOS-2). The level was presented as the fold change relative to that of the hFOB1.19 cells. Quantitative RT-PCR was carried out in triplicate, at the minimum (error bars, ± SD. ** p < 0.01 versus hFOB1.19). (C) Axin2 and Snail protein levels of osteosarcoma cell treated with niclosamide and pyrvinium by using Western blotting. Representative images are shown from at least two independent experiments. For uncropped figures, see Figure S1. (D) The Axin2 and Snail mRNA level in Axin2 knockdown cells. Cells were transfected with scrambled control and siAxin2. Axin2 and Snail transcript abundance was analyzed with quantitative RT-PCR. Quantitative RT-PCR experiments were carried out in triplicate, at the minimum (error bars, ± SD. * p < 0.05, ** p < 0.01 versus siControl).

