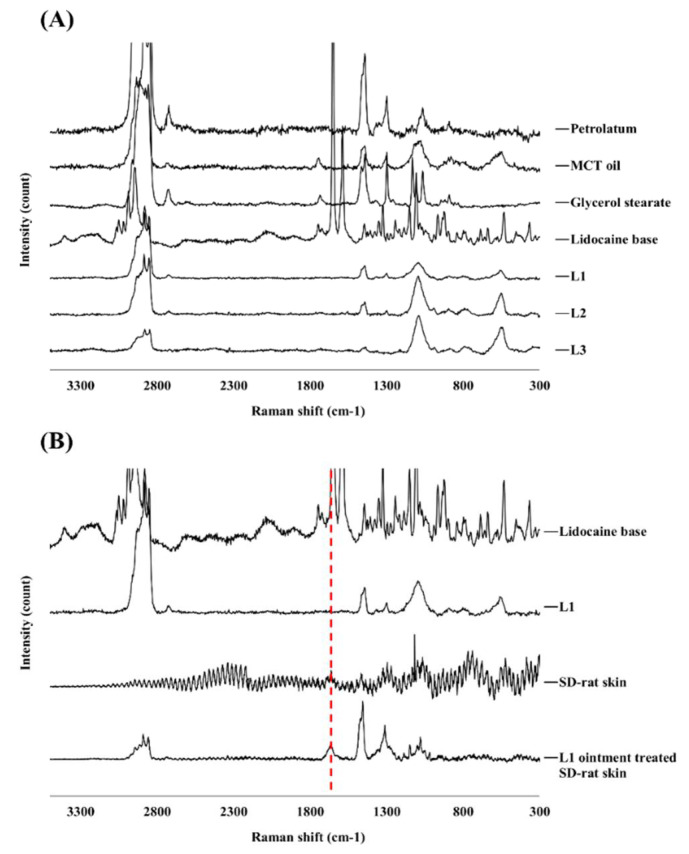
Figure 3.
Examination of compounds by Raman spectra. (A) Raman spectra of the raw materials, and prepared lidocaine ointments; (B) Raman spectra of lidocaine base, L1 ointment, SD-rat skin, and L1 ointment treated SD-rat skin (red line: Raman peak of lidocaine base at 1670 cm−1). SD: Sprague-Dawley.

