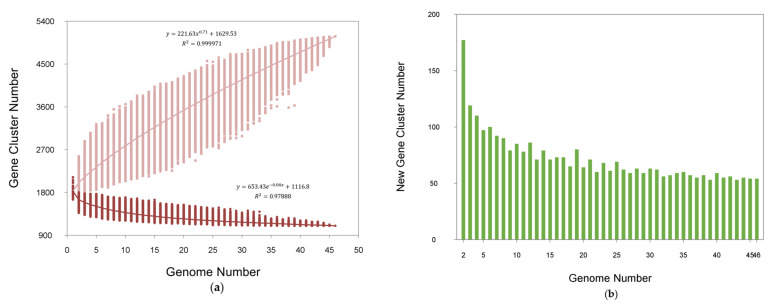
Figure 1.
Pan-genome and core-genome of L. acidophilus. (a) Pan-genome plot is represented by the accumulated number of new genes against the number of genomes added. Core-genome plot is represented by the accumulated number of genes attributed to the core-genomes against the number of added genomes. (b) The new gene cluster number plot shows the changes in new genes of all strains genomes as the number of L. acidophilus strains increases.

