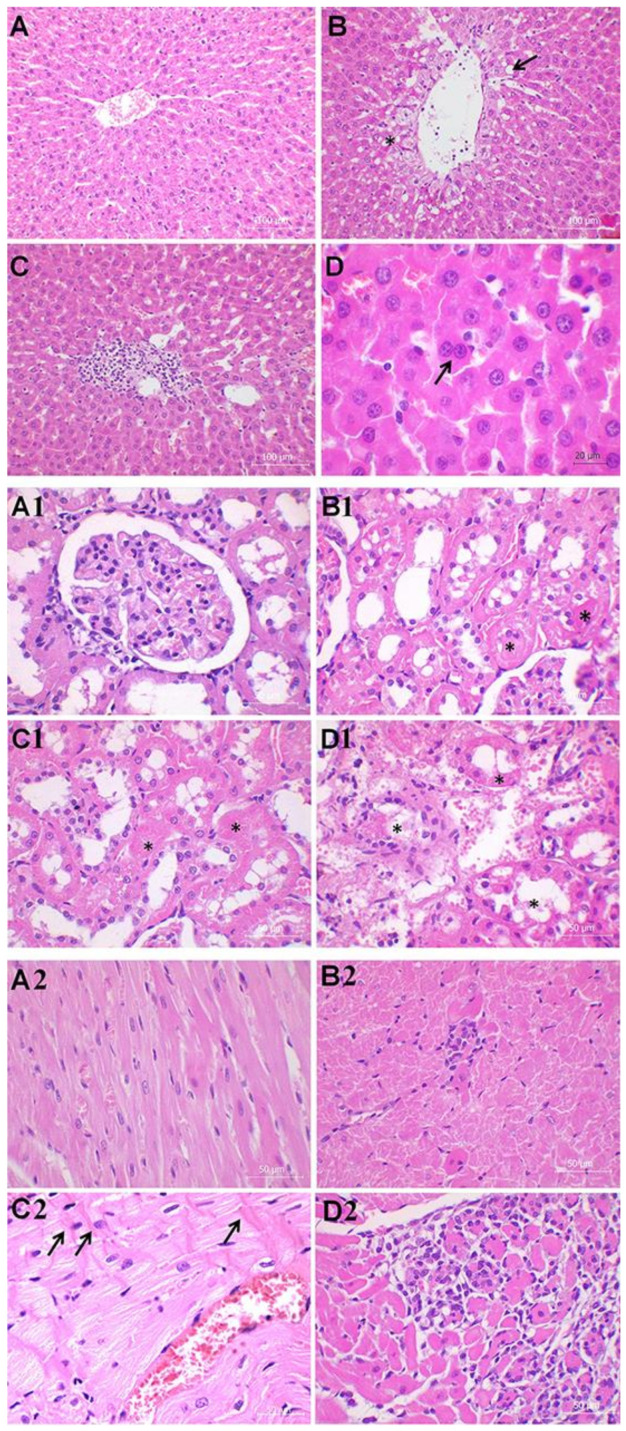
Figure 2.
Liver histology analysis (40× and 60×). Group categories abbreviations: (A) control (C) rat group; (B,C) sepsis (S) rat group; (D) meldonium + sepsis (M + S) rat group. Results of liver analysis: (A) Normal histological structure of the hepatic tissue; (B) The black asterisk indicates the parenchymal vacuolization owing to the hydropic degeneration and cytoplasm swelling of the hepatocytes. The black arrow indicates steatosis; (B,C) Micrography presents necrosis of larger groups of hepatocytes (patchy necrosis) and sinusoidal congestion with the extravasation of erythrocytes; (D) The black arrow indicates binucleation of hepatocytes. Kidney histology analysis (40 ×). Group categories abbreviations: (A1) control (C) rat group; (B1) sepsis (S) rat group; (C1,D1) meldonium + sepsis (M + S) rat group. Results of kidney analysis: (A1) Normal histological structure of glomeruli and tubules; (B1) Micrography displays moderate kidney damage with the reduction or complete loss of the epithelial brush border. The black asterisk indicates rare bleb formation; (C1,D1) Severe tubular necrosis with dilatation of the tubular structure, tubular lumen obstruction, and partial loss of tissue architecture is presented. The black asterisk indicates tubular lumen obstruction. Heart histology analysis (40×). Group categories abbreviations: (A2) control (C) rat group; (B2) sepsis (S) rat group; (C2,D2) meldonium + sepsis (M + S) rat group. Results of heart analysis: (A2) Control rats showing normal histological structure; (B2) Micrography displays myocytolysis, interstitial mononuclear infiltration, and a loss of striation; (C2,D2) Micrography shows severe and diffuse interstitial mononuclear infiltration with greater loss of myocytes. Contraction band necrosis is characterized by the bright eosinophilic cross-bands within the cells (as indicated by the black arrows).

