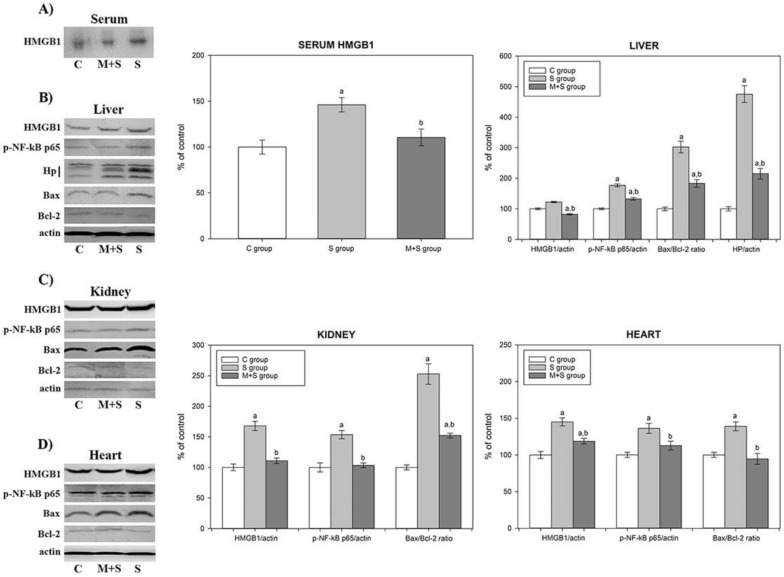
Figure 3.
Representative immunoblots of protein expression levels: (A) serum HMGB1; (B) liver HMGB1, p-NF-κB p65, Hp, Bax, and Bcl-2; (C) kidney HMGB1, p-NF-κB p65, Bax, and Bcl-2; and (D) heart HMGB1, p-NF-κB p65, Bax, and Bcl-2 in rats of control (C), sepsis (S), and meldonium + sepsis (M + S) groups. β actin was used as a loading control. Protein expression levels were calculated and graphically presented as the percent of control (mean ± standard error). Note: tissue samples were loaded on the gels in the groups order C, M + S, and S (blots presented on the left side of the figures), whereas calculated protein expression levels were graphically presented in the groups’ order C, S, and M + S (graphs presented on the right side of the figure). Minimal significance level: p < 0.05. Significantly different: a in respect to C; b in respect to S.

