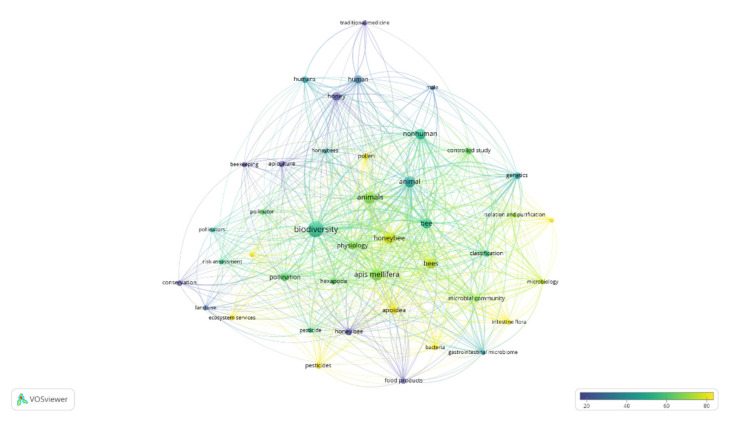
Figure 7.
Term map of the relationships of honey, health, and biodiversity research. Bubble size represents the number of publications. Bubble color represents the citations per publication (CPP). Two bubbles are closer to each other if the terms co-appeared more frequently (bibliometric data were extracted from the Scopus online database and elaborated by VOSviewer software).

