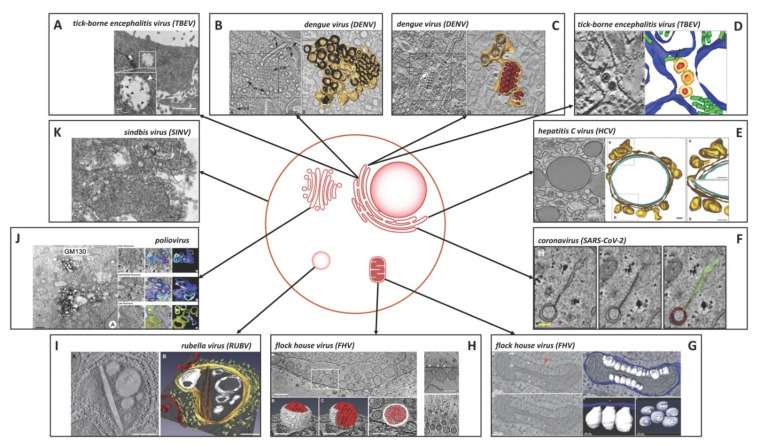
Figure 3.
Structure and origin of animal positive-strand RNA virus replication organelles. (A) TEM images of HeLa cells transfected with the TBEV DNA replicon. White arrowheads show dilated ER areas; black arrowheads denote replication-vesicle-like structures inside the dilated ER areas. Insets show magnifications of the indicated areas. Scale bars 1 μm [41]. (B,C) DENV-infected Huh7 cells. (left) Tomogram slice shows DENV-induced convoluted membranes (CM), vesicles (Ve), and tubes (T) that form a network of interconnected membranes in continuity with ER membranes. (right) 3D surface model of the membranes in the boxed area. The outer (cytosolic) face of the continuous membrane network is depicted in yellow; the ER lumen is dark [15]. (left) Stacked virus particles are in ER cisternae that are directly connected to virus-induced vesicles (white arrow). (right) 3D surface model of the virus-induced structures in the boxed area showing the continuity of virus-and vesicle-containing ER cisternae. ER membranes are depicted in yellow, inner vesicle membranes in light brown, and virus particles in red [15]. (D) Proliferation of the ER in human neuronal cells infected with TBEV. TBEV particles and TBEV-induced vesicles are located inside the proliferated and reorganized cisternae of the rough ER. 3D reconstruction of lamellar whorls, which are surrounded by cisternae arising from the rough ER (blue) and accommodate tubule-like structures (green). Detailed image shows the connection between the envelope (yellow) of a TBEV particle with nucleocapsid (red) and a tubule-like structure (indicated with an arrow) inside the rough ER. Scale bars 50 nm [19]. (E) 3D model of the HCV replication organelles surrounding lipid droplets. Electron tomography suggests that DMVs arise from ER membranes that are tightly wrapped around lipid droplets. (Left) Single tomographic slice of an HCV-infected cell with lipid droplets that are tightly wrapped by ER membranes and that stain positive for E2 and NS5A as revealed by fluorescence microscopy (not shown). (right) 3D reconstruction of the membranes surrounding the lipid droplet. ER membranes and DMVs are shown in yellow; the phospholipid monolayer of the lipid droplet monolayer membrane is shown in cyan. Insets illustrate that the DMVs originate from the wrapping ER membrane. Scale bars 100 nm [45]. (F) High-resolution analysis of ER-DMV interconnectivity in SARS-CoV-2-infected Calu-3 cells. Tomogram slices depict a membrane connector or zippered ER (light green) in contact with a DMV (red). (right) Superposition of rendered DMV and ER. Scale bars 200 nm [25]. (G) Tomogram slices and 3D reconstructions of mitochondria in FHV-infected Drosophila cells. (Left) Tomogram slices showing FHV-induced spherule rearrangements of a mitochondrion. Labels denote outer mitochondrial membrane (OM) and inner mitochondrial membrane (IM). White arrowheads indicate the necks that connect spherules to the OM. Asterisks mark two spherules that connect via necks to the OM. A red arrow marks the ∼10 nm channel connecting the spherule interior to the cytoplasm. (upper right) 3D tomogram image with blue indicates OM, white indicates FHV spherules. (lower right) A close-up view of the connections between the OM and the spherules and 90° rotation of spherules showing the channels that connect the spherule interiors to the cytoplasm [29]. (H) (upper left) Tomogram slice of FHV spherules in a mitochondrion. Mitochondrial outer membrane (red), spherule membrane (blue), interior spherule filaments (black), and spherule openings (white) are indicated with arrowheads. Scale bar 100 nm. (lower left) 3D reconstruction of the spherule outlined in upper panel. Scale bars 50 nm. (right) Filaments are associated with FHV spherule pores. Tomographic slices with arrowheads pointing to the mitochondrial outer membrane (red), the spherule membrane (blue), the spherule opening (white), and the extruding filaments that likely represent viral RNA) (black). Scale bars 100 nm [30]. (I) 3D ET volumes of RUBV replication complex in BHK-21 cell. Tomogram slice (left) and the corresponding 3D model (right) of a CPV (yellow) surrounded by the rough ER (light green) and containing a number of vacuoles, vesicles, and a rigid straight sheet (brown) that is connected with the periphery of the CPV; mitochondria (red), vesicles and vacuoles (white) and cytoplasm (grey). Scale bars 200 nm [31]. (J) Poliovirus ROs in HeLa cells. (left) Viral replication structures are strongly associated with staining for a Golgi antigen, GM130. Scale bar 500 nm. (right) 3D reconstructions of poliovirus ROs at the early, intermediate, and late stages, 3, 4, and 7 hours post infection, respectively, each depicting central slices in tomographic volumes, central slices with segmented overlays, and segmented volumes, with blue indicating SMVs and yellow and green indicating inner and outer membranes of DMVs, respectively. Scale bars 100 nm [27]. (K) Plasma membrane invaginations and vacuole formation in SINV-infected BHK-21 cells. Scale bar 200 nm [32]. The different parts were reproduced with permission.

