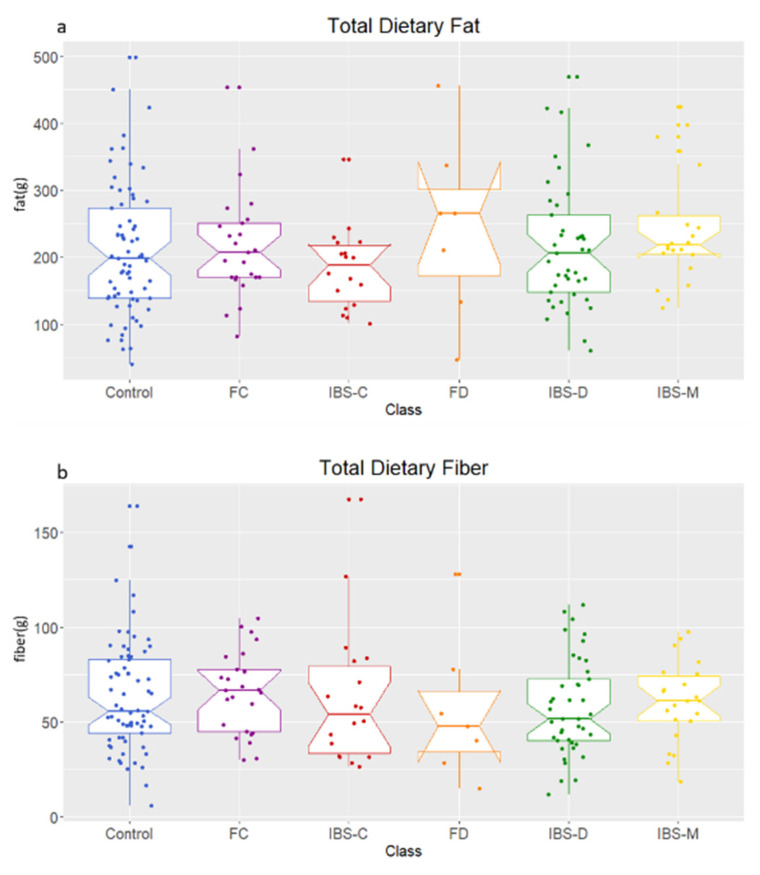
Figure 1.
Dietary intake of (a) fat and (b) fiber over 3-day period recorded using diet diaries for each participant. Healthy control (control), functional constipation (FC), IBS-constipation (IBS-C), functional diarrhea (FD), IBS-diarrhea (IBS-D), IBS-mixed (IBS-M). Boxplots show median (center line), 25th and 75th percentile (top and bottom of boxes, respectively), with whiskers representing 1.5 times the inter-quartile range, and boundaries of notches show 95% confidence interval (CI).

