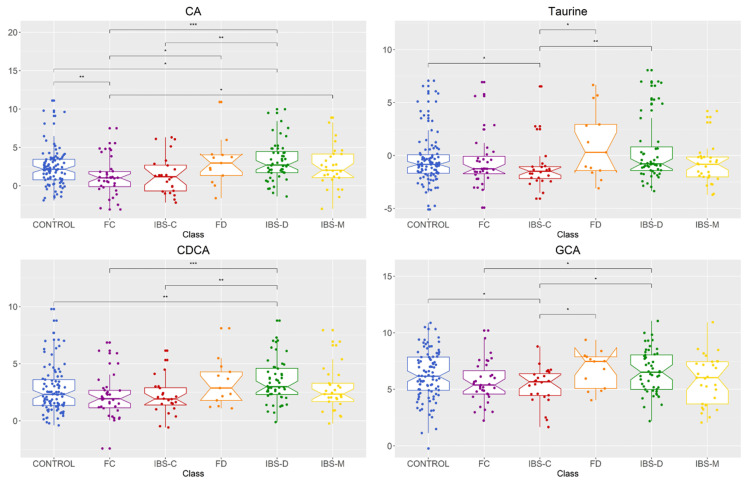
Figure 2.
Bile acid metabolite distributions among healthy control, IBS subtypes, and functional gut disorders groups for metabolites with significantly different abundances between groups. Data presented as logged values of µg/mg of fecal dried weight. Healthy control (control), functional constipation (FC), IBS-constipation (IBS-C), functional diarrhea (FD), IBS-diarrhea (IBS-D), IBS-mixed (IBS-M). Boxplots show median (center line), 25th and 75th percentile (top and bottom of boxes, respectively), with whiskers representing 1.5 times the inter-quartile range, and boundaries of notches show 95% confidence interval (CI). Statistical significance denoted as p < 0.05 (*), p < 0.01 (**), p < 0.001 (***). Abbreviations: cholic acid (CA), chenodeoxycholic acid (CDCA), glycol-cholic acid (GCA).

