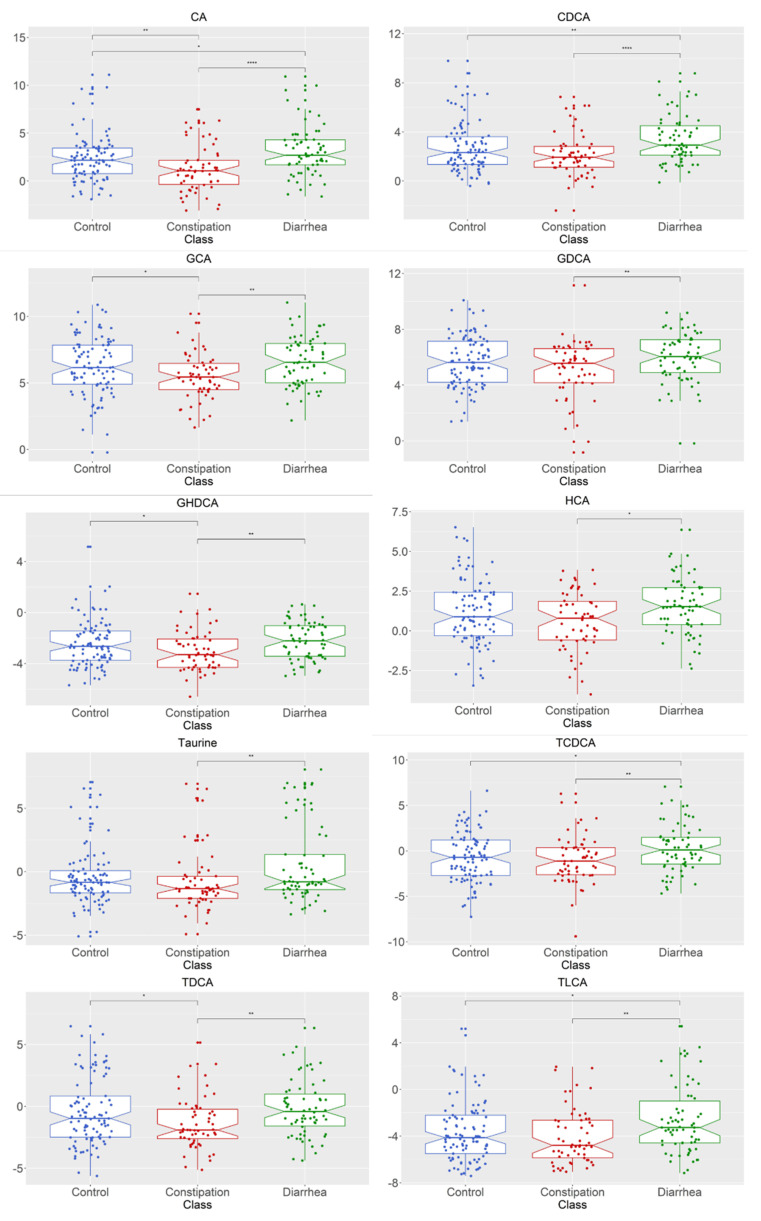
Figure 4.
Bile acid metabolite distributions between healthy control, constipation (FC + IBS-C) group, and diarrhea (FD + IBS-D) group for metabolites with significantly different abundances between groups. Data presented as logged values of µg/mg. Boxplots show median (center line), 25th and 75th percentile (top and bottom of boxes, respectively), with whiskers representing 1.5 times the inter-quartile range, and boundaries of notches show 95% confidence interval (CI). Statistical significance denoted as p < 0.05 (*), p < 0.01 (**), p < 0.0001 (****). Abbreviations: cholic acid (CA); chenodeoxycholic acid (CDCA); glyco-cholic acid (GCA); glyco-deoxycholic acid (GDCA); glyco-hyo-deoxycholic acid (GHDCA); hyo-cholic acid (HCA); tauro-cheno-deoxycholic acid (TCDCA); tauro-deoxycholic acid (TDCA); tauro-lithocholic acid (TLCA). Constipation group is defined as individuals with both functional constipation and IBS-C. Diarrhea group is defined as individuals with both functional diarrhea and IBS-D.

